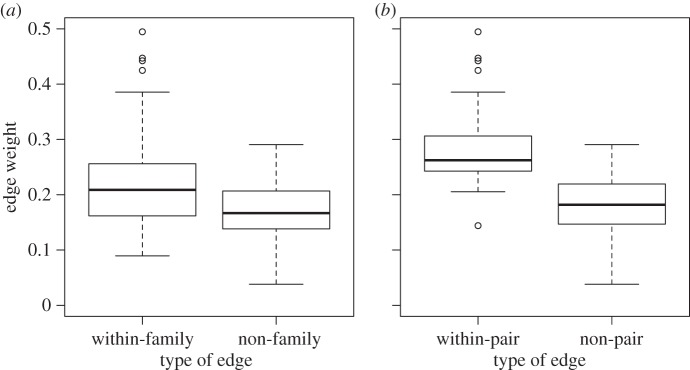
Figure 1.

Edges between family members (a), and particularly between paired mates (b) were the strongest in the network. Box plots show the median and 25th and 75th percentiles, whiskers indicate values within 1.5 times the interquartile range and circles are outliers.
