
. 2014 Dec 11;44(1):128–133. doi: 10.1097/MPA.0000000000000217
Copyright © 2014 by Lippincott Williams & Wilkins
This is an open access article distributed under the terms of the Creative Commons Attribution-NonCommercial-NoDerivatives 3.0 License, where it is permissible to download and share the work provided it is properly cited. The work cannot be changed in any way or used commercially.
FIGURE 1.
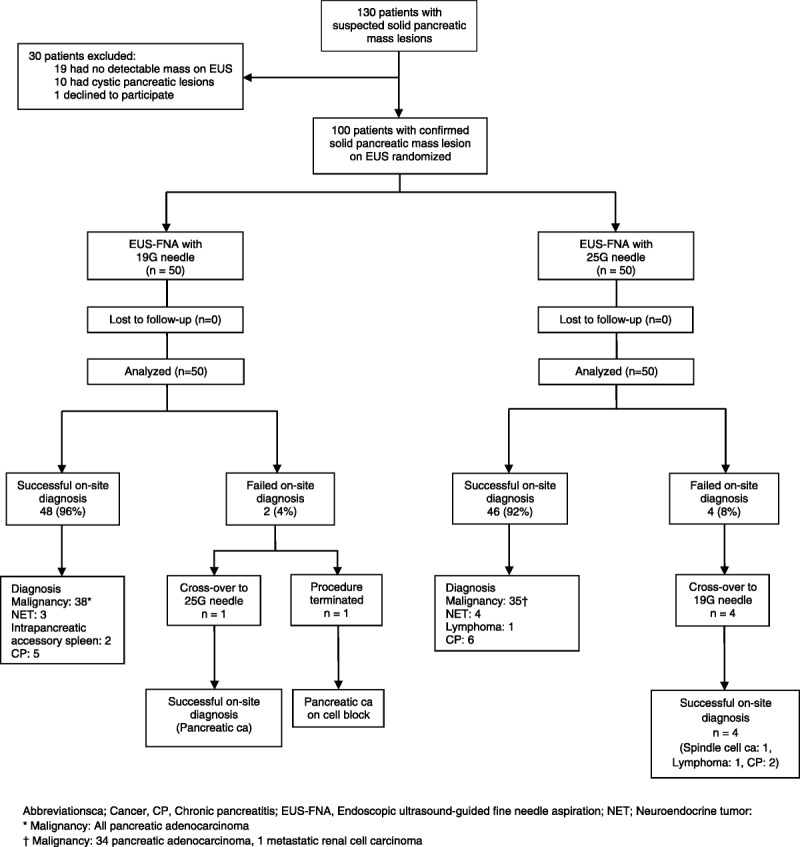
Flow diagram of the study results.