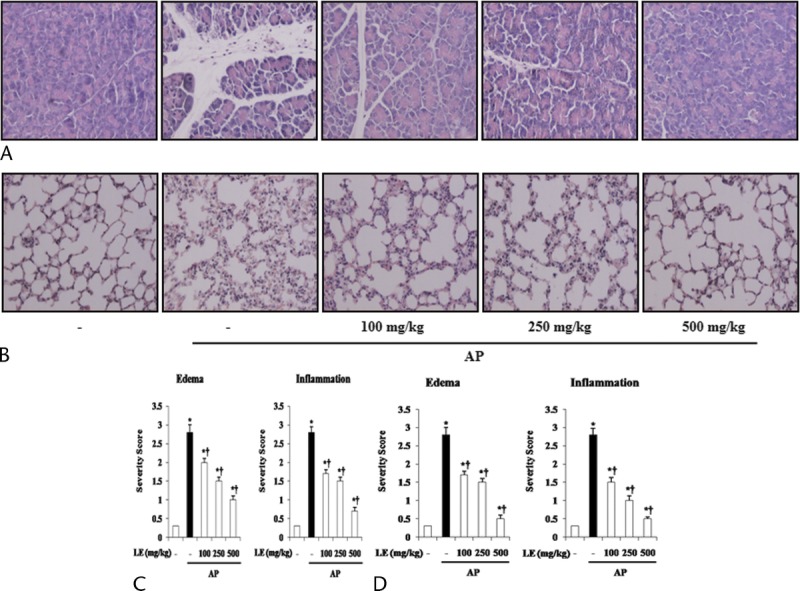
FIGURE 1.

Effects of LE on pancreatic damage and AP-associated lung injury during cerulein-induced AP. A and B, Representative H&E-stained pancreas and lung sections of control mice and mice pretreated with LE (100, 250, or 500 mg/kg) 1 hour before the cerulein (50 μg/kg)–mediated induction of AP. C and D, Histological sections of the pancreas and lung were scored from 0 (normal) to 3 (severe) for edema and inflammation. Data are represented as mean ± SE for 6 mice for each group. The results were similar in 3 additional experiments. y axis represents the means, and the error bars represent the SE. *P < 0.05 versus control group, †P < 0.05 versus cerulein treatment alone. Original magnification ×400.
