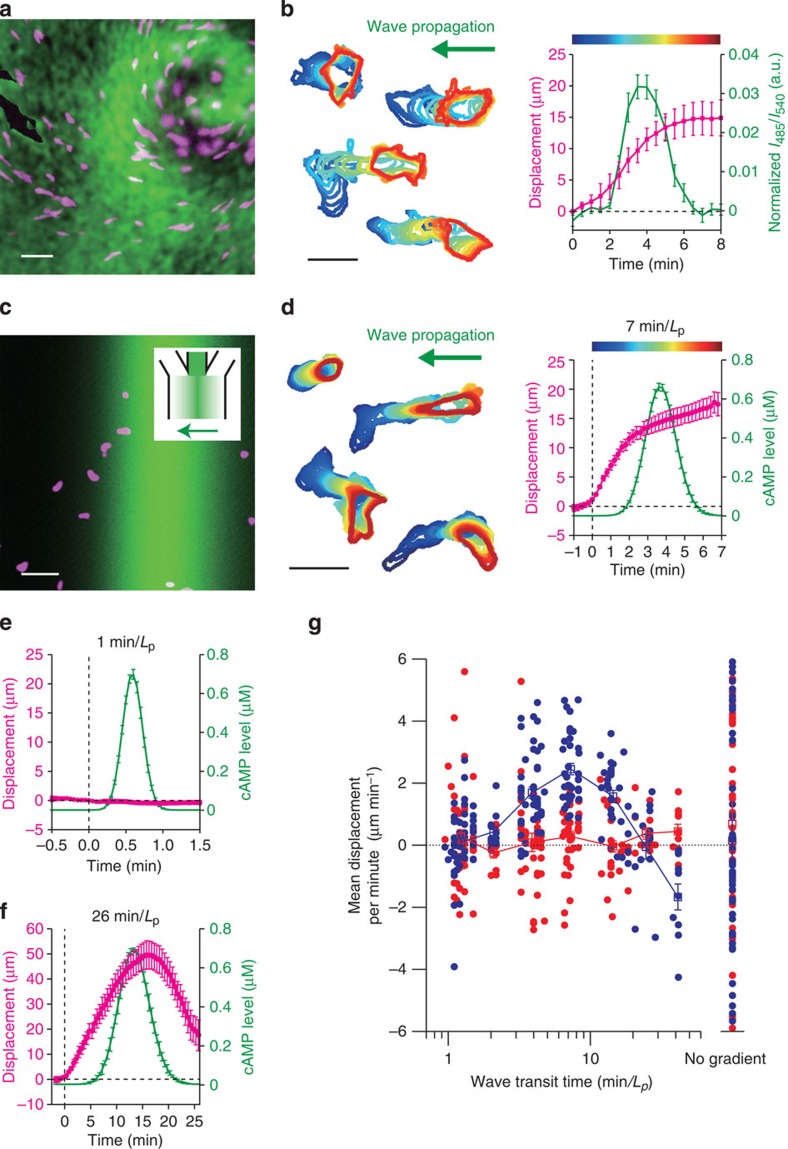
Figure 1. Chemotaxis in natural and artificial travelling waves of the chemoattractant cAMP.
(a,b) cAMP waves and cell movement in the aggregation field. A frame-subtracted image of cytosolic cAMP (a, green; Epac1-camps43,66) and a fraction of cells co-expressing RFP for cell tracking (a; magenta) (see Methods). Cell contours (b; left panel) and cell displacements (right panel; n=7). Colours (left panel) represent the phase of cAMP waves (right panel). (c) A snapshot of an imposed wave (c, green; fluorescein) and cells (c; magenta). A schematic of the infusing flows (c; inset). (d–f) Cell displacements towards the cAMP pulse of 7 min per Lp (d, n=21), 1 min per Lp (e, n=16) and 26 min per Lp (f, n=6) duration. Time t=0 indicates the point at which the stimulus concentration exceeded a threshold (0.01% of the maximum) (see Methods). (g) Average velocity of cell migration parallel to the direction of wave propagation (g, n=199; blue). The velocity is positive in the direction against the incoming wave. The average cell velocity orthogonal to the propagating direction (g; red; control). The average from 4-min mock fluorescein waves (in the absence of cAMP (n=10) and 1 nM spatially uniform background cAMP (n=39)) (g, no gradient). Error bars indicate s.e.m. Scale bars; 50 μm (a,c) and 20 μm (b,d).

