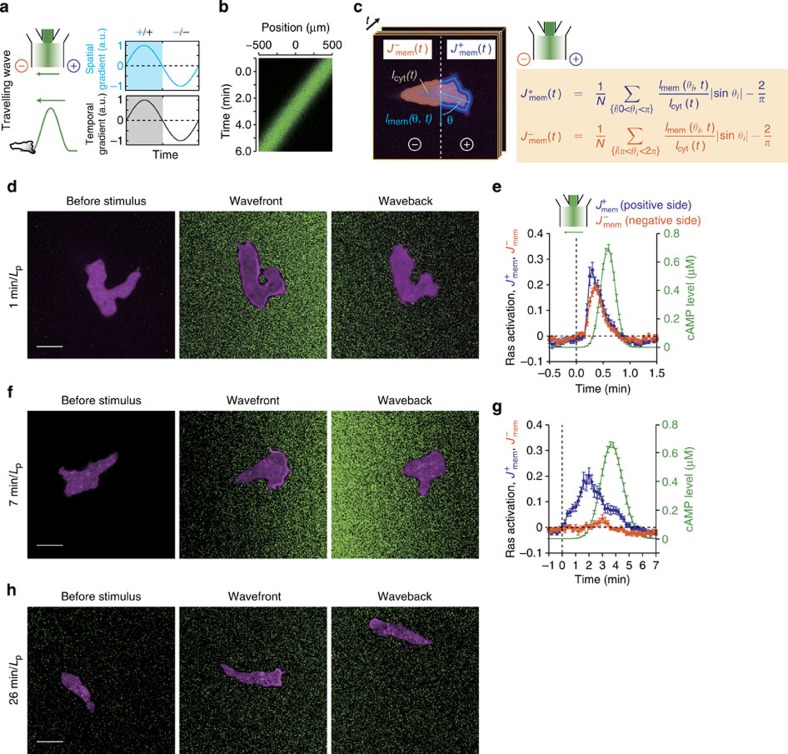
Figure 2. Ras response in the travelling wave stimulus is time dependent.
(a,b) Propagating wave stimulus. (c) A schematic of quantification of RBD membrane localization (see Methods for details). (d–h) RBD translocation during the travelling wave stimulus; transit time 1 min per LP (d,e), 7 min per LP (f,g) and 26 min per LP (h). Representative confocal images of spatially localized Ras activity (RFP-RBD; magenta) induced by the artificial cAMP wave stimuli (fluorescein; green) (d,f,h). Time series of RBD translocation to the positive side (blue) and the negative side (orange) (e,g). Time t=0 indicates the point at which the stimulus concentration exceeded a threshold (0.01% of the maximum). A half side of the cell boundary facing the right-hand side of the chamber was defined as the positive side (see Methods). For the wave stimulus of 26 min per LP transit time, active cell movement in the z axis direction prevented us from obtaining reliable time series. Data are averages over n=16 (e) and 21 (g)±s.e.m. (error bars). Scale bar, 10 μm.

