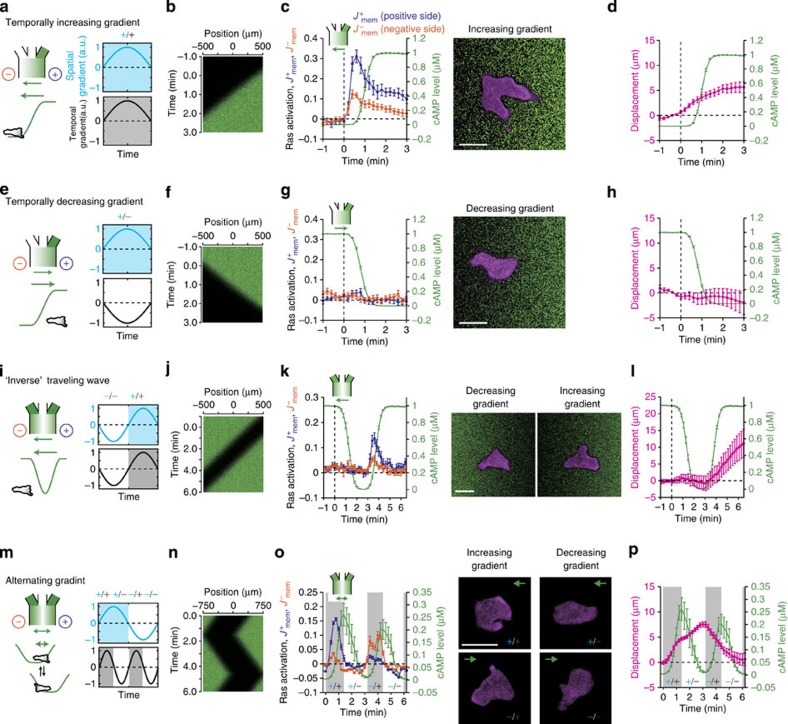
Figure 3. Chemotaxis and directional sensing in dynamically changing gradients are rectified by temporal information.
(a–d) Temporally increasing gradient. (e–h) Temporally decreasing gradient. (i–l) Inverse wave. (m–p) Alternating gradient. The sign of the space (blue)/time (grey) derivatives of the stimulus are indicated by ‘+’ and ‘−’ (o,p). Schematics (a,e,i,m), and the space–time plot (b,f,j,n) of the stimulus. RBD localization in the positive and negative direction (c,g,k,o; left panel; blue and orange) and representative confocal images (c,g,k,o; right panels). Cell displacement (d,h,l,p; magenta). Time series of the extracellular cAMP level (c,d,g,h,k,l,o,p; green). Time t=0 indicates the point at which the stimulus concentration was above (c,d) or below (g,h,k,l) a threshold (0.01% of the maximum for c and d; 99.5% for g, h, k and l). Data were averages over n=13 (c,d), 22 (g,h), 21 (k,l) and 6 (o,p) cells. Error bars indicate s.e.m. Scale bar, 10 μm.

