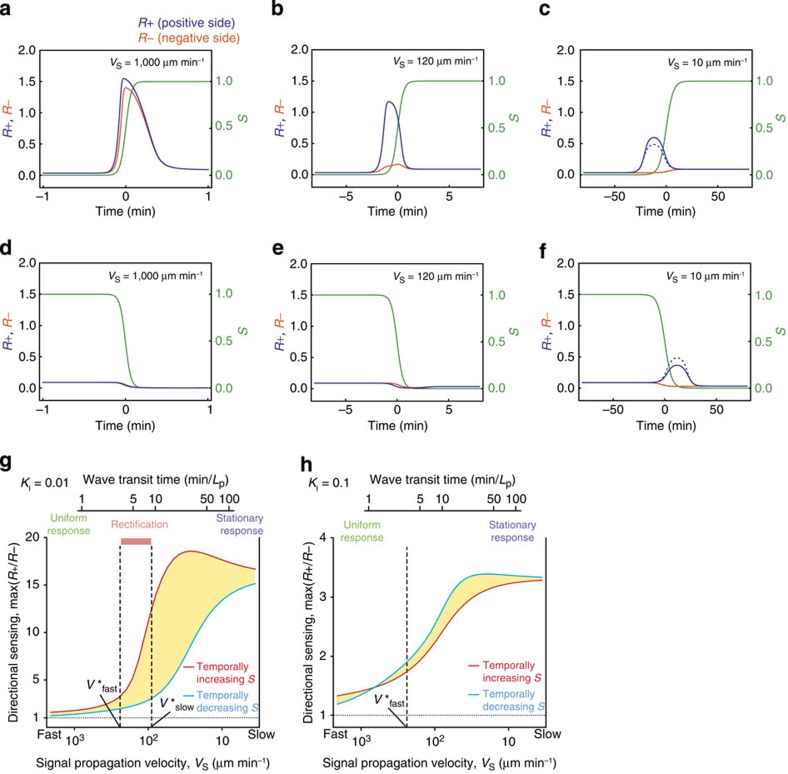
Figure 8. Rectified directional sensing can be attributed to the low-pass filter characteristics in the ultrasensitive circuit.
(a–f) Time series from the numerical simulations in the ultrasensitive LEGI model (KI=0.01). Response in the positive (+) side (R+, blue) and the negative (−) side (R−, orange) of a cell to monotonic gradients that are increasing (a–c) or decreasing (d–f) in time. The spatial-temporal profiles of S were the same as in Fig. 6f–i. Monotonic gradients move from right to left (in the (−) direction) for temporally increasing gradients, and left to right (in the (+) direction) for temporally decreasing gradients. Hence, the positive (+) direction always faces higher concentrations of the monotonic gradients. The propagation velocity VS for fast- (VS=1,000 μm min−1; a,d), intermediate- (120 μm min−1; b,e) and slow- (10 μm min−1; c,f) moving gradients. Dashed lines (c,f) indicate the analytically obtained stationary states of R+ and R− for a given signal gradient evaluated at each time point. (g,h) Maximum values of the ratio R+/R− in response to temporally increasing (red) and decreasing (cyan) spatial gradients in the ultrasensitive LEGI model at KI=0.01 (g) and KI=0.1 (h). Corresponding wave transit time for LP=800 μm is indicated (g,h; top x axis label). Asymmetry in directional sensing to temporally increasing and decreasing stimulus is highlighted by the shaded regions. The characteristic velocity, V*fast and V*slow are indicated in black dashed lines. See Supplementary Table 1 for model parameters.

