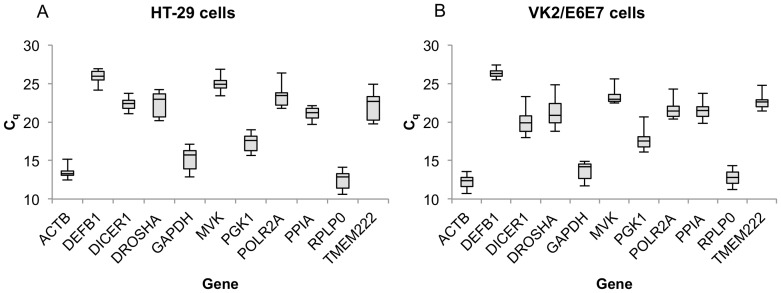
Figure 1. Range of Cq values for the colonic HT-29 (A) and vaginal VK2/E6E7 (B) cell lines.
The range of Cq values as measured by qPCR for both the HT29 (A) and VK2/E6E7 (B) cells. The plots highlight the median (centre line), maximum and minimum (whiskers), and 1st and 3rd quartile marks (boxes) of the data. All Cq values measures were within the bounds of the linear dynamic range as determined by standard curve analysis.

