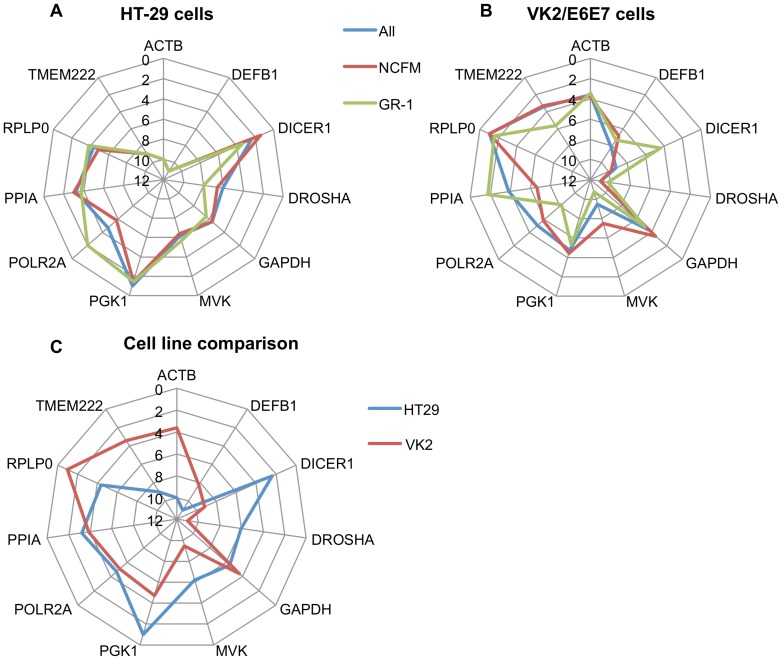
Figure 4. Comparison of reference gene rankings based on cell type and bacterial challenge.
Gene names are around the outside of the wheel and follow the radial lines. The numbered concentric lines indicate the geometric ranking. The further away from the centre the line is, the more stable the reference gene. Each data set is plotted with a different colour. The degree to which the coloured lines overlap indicate how well the data sets correlate to each other. A. Colonic HT-29 cells. Blue: combined data set. Red: Lactobacillus acidophilus NCFM used as the commensal strain. Green: Lactobacillus rhamnosus GR-1 used as the commensal strain. B. Vaginal VK2/E6E7 cells. Blue: combined data set. Red: L. acidophilus NCFM used as the commensal strain. Green: L. rhamnosus GR-1 used as the commensal strain. C. Comparison of combined data sets of the HT-29 and VK2/E6E7 cell lines. Blue: HT-29 cells. Red: VK2/E6E7 cells.

