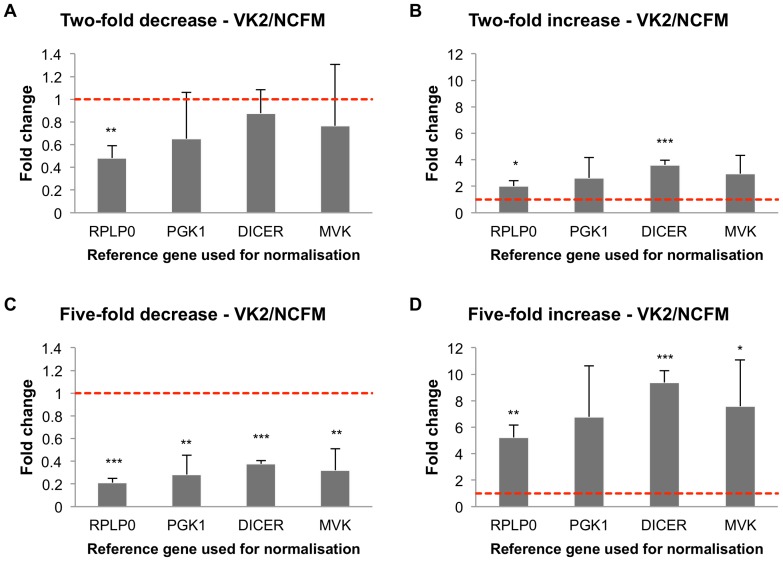
Figure 6. Simulation of hypGOI expression study in VK2/E6E7 cells treated with Lactobacillus acidophilus NCFM.
The columns show the effect of treatment on a hypothetical gene of interest (hypGOI) when normalising against the different reference genes based on expression levels determined in this study. The most stable gene assessed (RPLP0) was used as the standard for the target fold changes, which were set at two-fold decrease (A), two-fold increase (B), five-fold decrease (C), and five-fold increase (D). The three lower-ranked reference genes assessed (PGK1, DICER1, and MVK) are shown in order of decreasing stability as determined in this study. The control expression level was set at one as an arbitrary reference point, and is shown by the dashed red line. Error bars indicate the standard deviation.

