
Figure 1. Optimal number of surveys (contours) when maximizing the expected probability of detection as a function of the budget to fixed-cost ratio B/c ( = B′/c′) and the coefficient of variation θ.
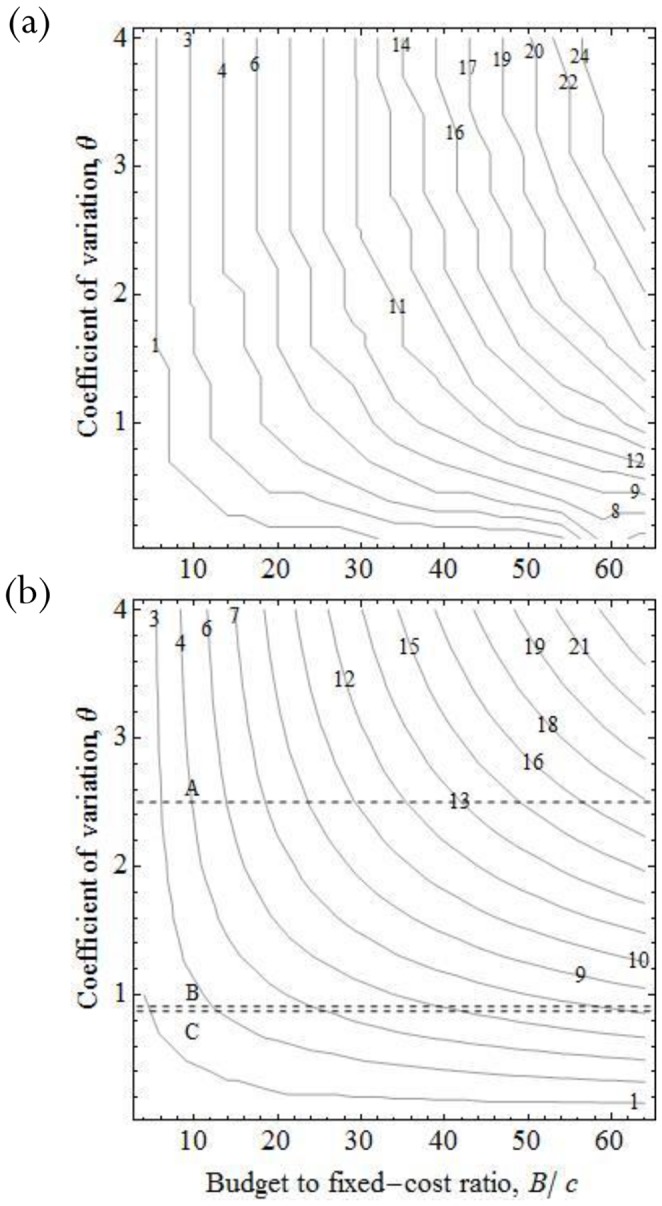
The figures compare the exact solution with c′ = 0.5 (a) and approximate solution (b). For the approximate solution, dashed-line A corresponds to Litoria pearsoniana (θ = 2.45), dashed-line B corresponds Atriplex semibaccata (θ = 0.91) and dashed-line C corresponds Lomandra longifolia (θ = 0.87). Note that exact solution depends on the value of B, not just the ratio B/c, hence lines indicating the optimal number of surveys for the case studies are not shown on (a).