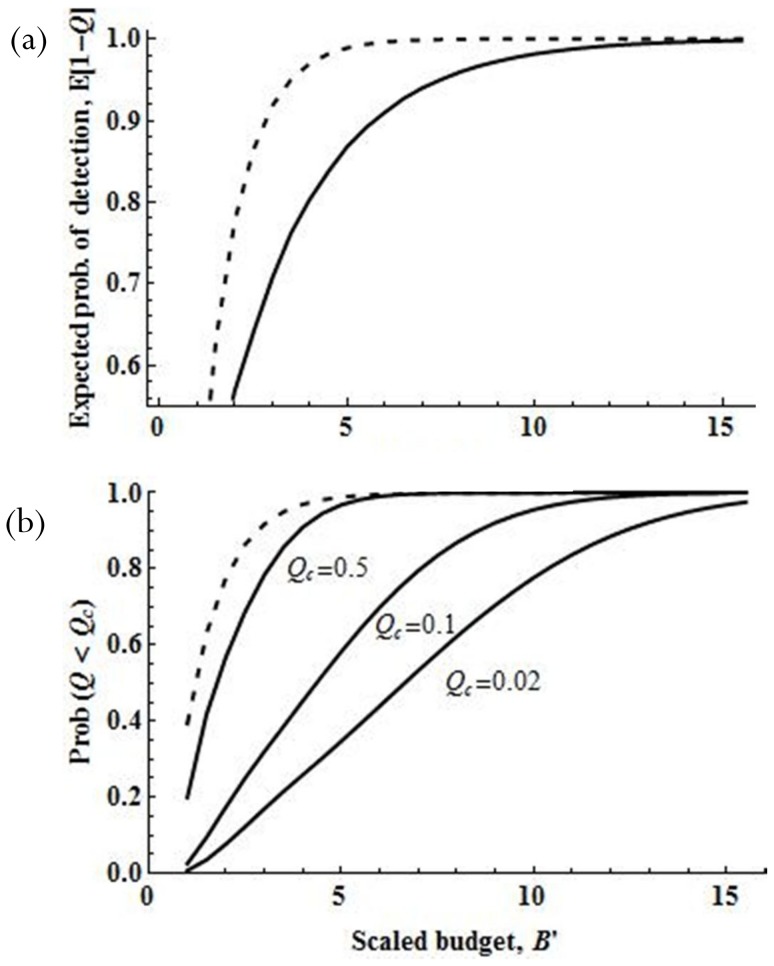
Figure 3. Expected probability of detection (a) as a function of the scaled budget B′, with c′ = 0.5, when detection rate is assumed to be variable (solid line, θ = 1.5) compared to when it is assumed to be constant (dashed line).
Likelihood that the failed-detection probability Q is less than the prescribed value Qc (b) as a function of the scaled budget B′, with θ = 1.5 and c′ = 0.5, when detection rate is assumed to be variable (solid lines) compared to when it is assumed to be constant (dashed line).

