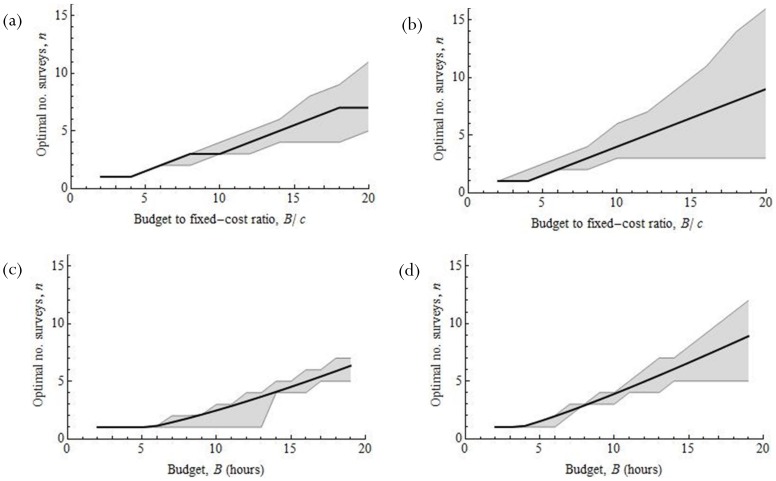
Figure 4. Optimal number of surveys for Litoria pearsoniana when the objective is to maximize the expected probability of detection (a & b), and maximize the probability of satisfying a prescribed detection rate of 95% (c & d).
Abundance = 1 (µ = 0.67) in (a) & (d), and abundance = 3 (µ = 2.2) in (b) & (d). The shaded area is the region such that the expected probability of failed detection is no more than 0.01 probability units away from the optimum. The correlation coefficient r = 0.3, fixed cost c = 1 hour and survey season length T = 90 days.

