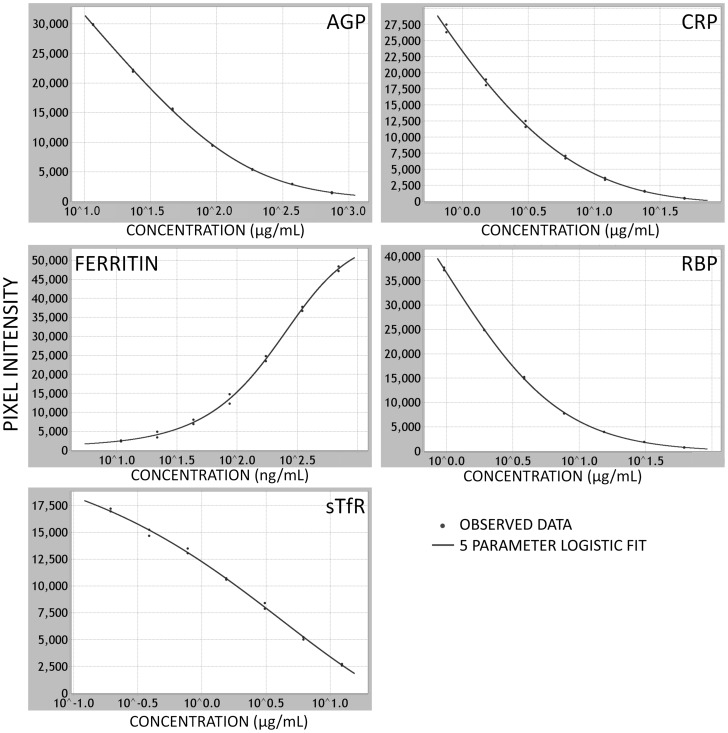
Figure 2. Standard curves for each of the 5 analytes.
The standard curves generated after 5-PL regression analysis across seven twofold dilutions of the Liquichek 3 standards for each assay in the multiplexed array. AGP, CRP, RBP and sTfR assay plots are from the basic antigen competitor assays and show concomitant decrease in chemiluminescence as the concentration of analyte is increased reflecting the non-labeled antigen out-competing the biotinylated antigen. In the ferritin sandwich assay, the chemiluminescence increases with analyte concentration reflecting the increased binding of the labeled secondary antibody to the captured ferritin. AGP, alpha-1-acid glycoprotein; CRP, C-reactive protein; RBP, retinol binding protein 4; sTfR, soluble transferrin receptor.

