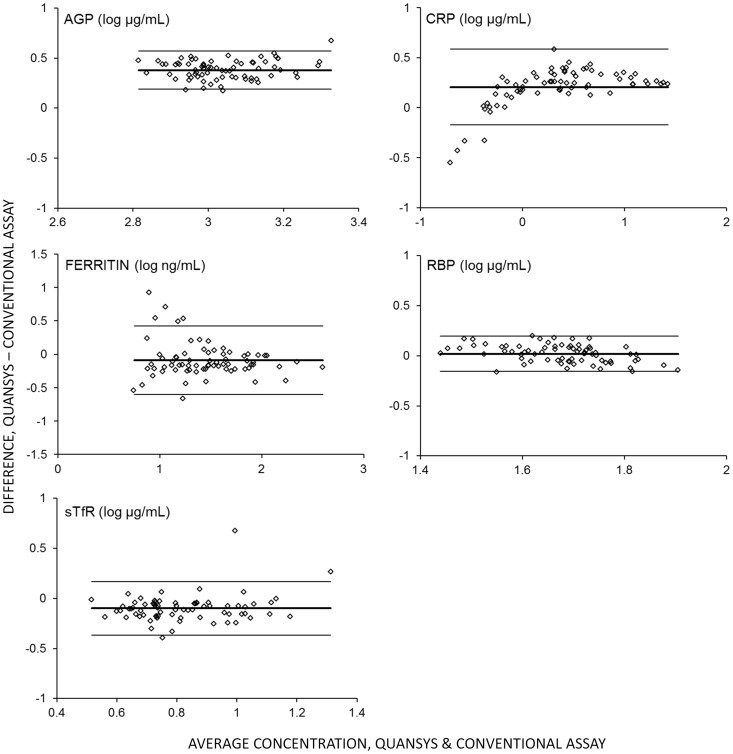
Figure 5. Bland-Altman analysis.
Bland-Altman plots of differences between log concentrations (y-axes) versus the average concentrations (x-axes) for each analyte in 72 plasma specimens assayed using the Quansys MMAT and conventional assays. Center solid line indicates mean difference; upper and lower solid lines indicate the 95% confidence interval. AGP, alpha-1-acid glycoprotein; CRP, C-reactive protein; RBP, retinol binding protein 4; sTfR, soluble transferrin receptor.

