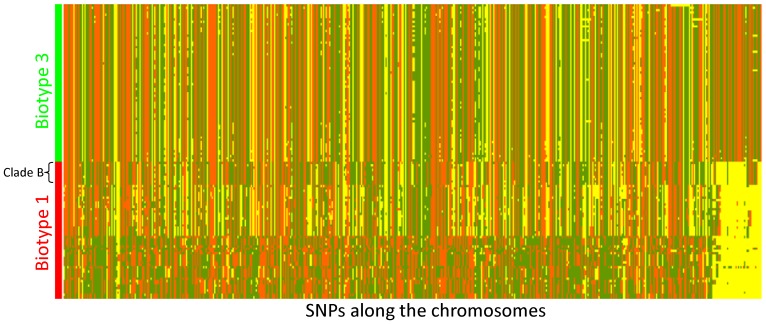
Figure 3. Heat map of genotyping data at 570 SNPs of 127 strains isolated in Israel.
V. vulnificus strains (vertical axis) are arranged according to their phylogenetic relationships and marked by biogroups (68 biotype 3 isolates and 59 representative biotype 1 isolates). Allelic variations of SNPs (horizontal axis) are ordered according to their position along the two bacterial chromosomes (according to the YJ106 genome). The last 40 SNPs (on the right) were selected as unique to biotype 3 based on its draft genome (VVyb1(BT3)). Different colors represent the different alleles: allele 1 – orange, allele 2 – green, and “no product” allele – yellow.

