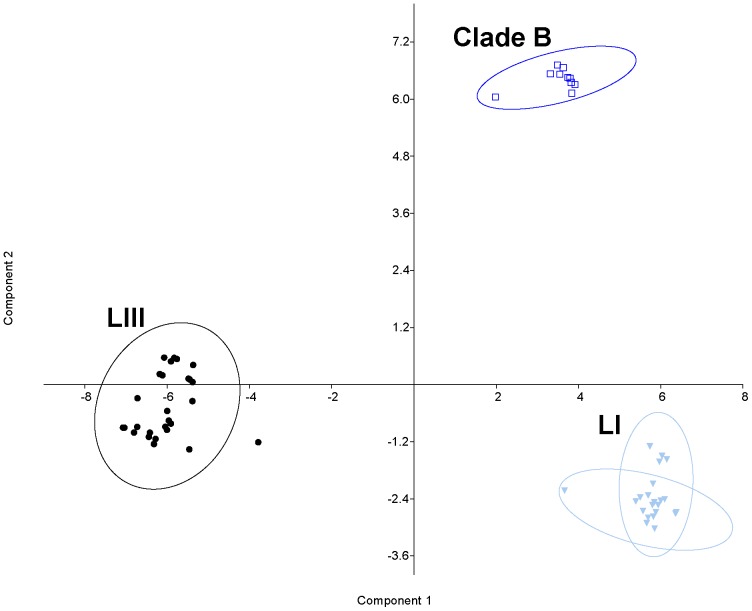
Figure 4. PCA of genotyping data of Israeli biotype_1 strains processed in relation to synthetic biotype_3 haplotype.
Principal component analysis (PCA) was carried out on datasets containing 530 SNPs. The scatter diagram of a cluster analysis performed with PCA is shown; the strains (dots) are classified into two or three groups with the following color code: LI – light blue, azure, LIII – black, LI-clade-B – dark blue. Together, components PC1 and PC2 explain 50% of the variance (38 and 12%, respectively); 95% confidence ellipses around each group are indicated.

