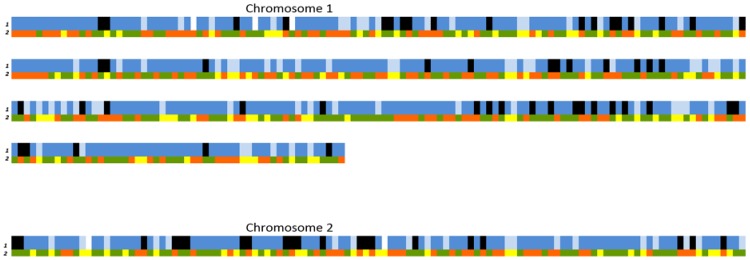
Figure 5. The group origin map of the biotype 3 haplotype in comparison to the synthetic haplotype.
Data are arranged in three rows representing the 530 SNPs along the V. vulnificus chromosomes (genome). (1) The group origin map based on PCA results (Fig. 4). Blue – SNPs originated in LI-clade-B, light blue – SNPs originated in LI, black – SNPs originated in LIII; SNPs that were not found in any of the 59 tested biotype 1 strains were not colored. (2) The synthetic haplotype of biotype 3. The different alleles are color coded as follows: allele 1 – orange, allele 2 – green, and “no product” allele – yellow.

