
Figure 1.
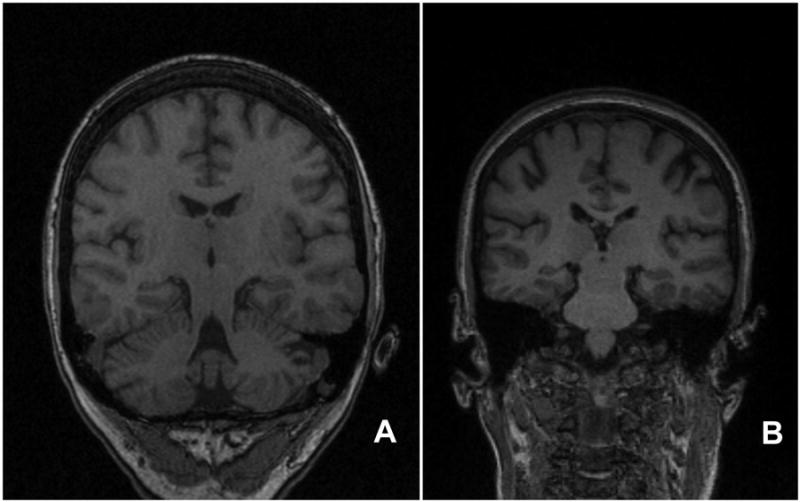
The figure shows representative images from the MRP1 and MPR2 sequences from subject 1. Figure A is the MPR1 image, and Figure B is the MPR2 image. Each image demonstrates the coronal plane near the mid-section of the body of the hippocampus. Because of differences in the angle of acquisition for each sequence, structures included in the representative images differ, such as inclusion of the cerebellum in panel A, but not in panel B. The images serve to demonstrate differences in the protocols, including different image resolution, gray-scale intensity contrast, and angle of acquisition of the images.