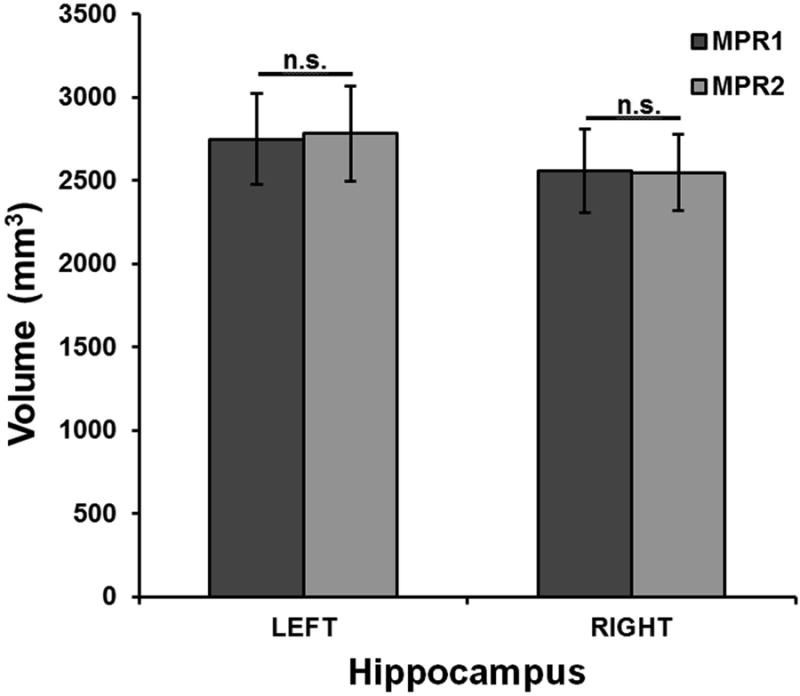
Figure 2.

Volumetric differences between MPR1 and MPR2 sequences. Mean hippocampal volumes comparing the MPR1 and MPR2 sequences, with error bars showing 1 SD ranges in each group. Highly consistent volumetric measurements were obtained across MRI sequences.
