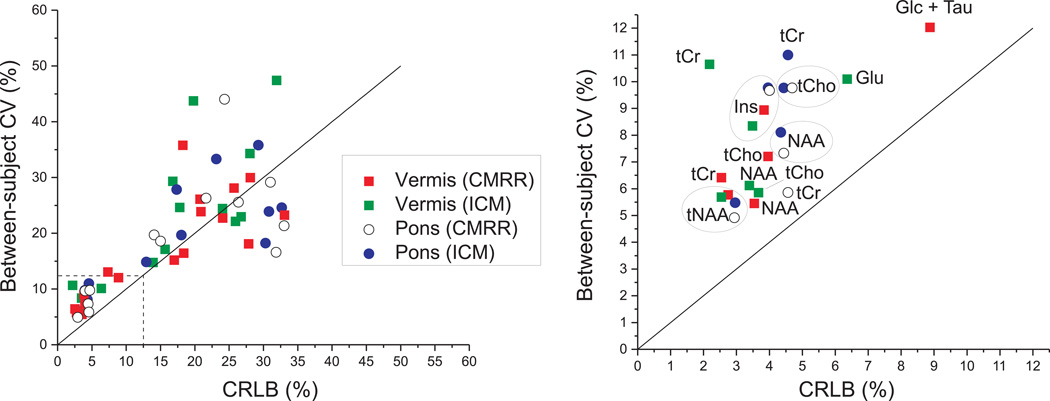
Figure 3.
Relationship between mean CRLB and between-subject coefficients of variance (CV) for all metabolites reported in Figure 2: CV and CRLB ≤ 50% (left) and zoomed CV and CRLB between 0 and 12.5% (right). The solid line represents the identity line.

