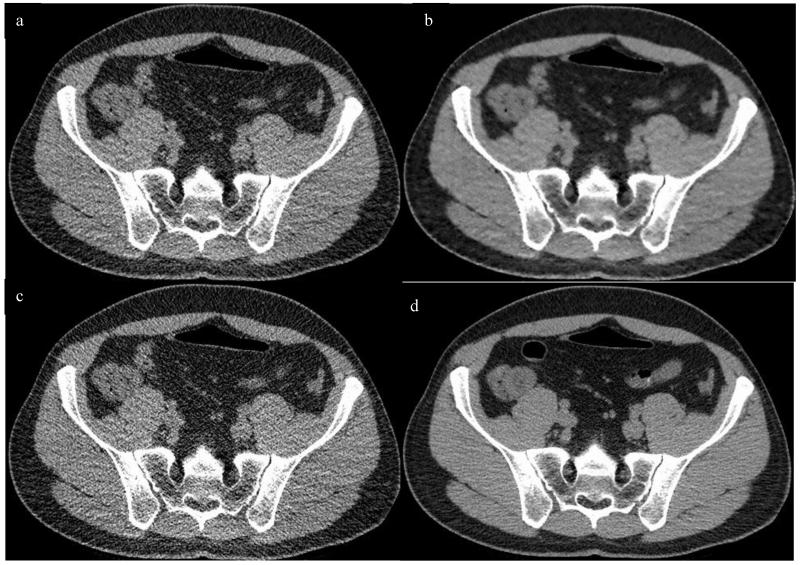
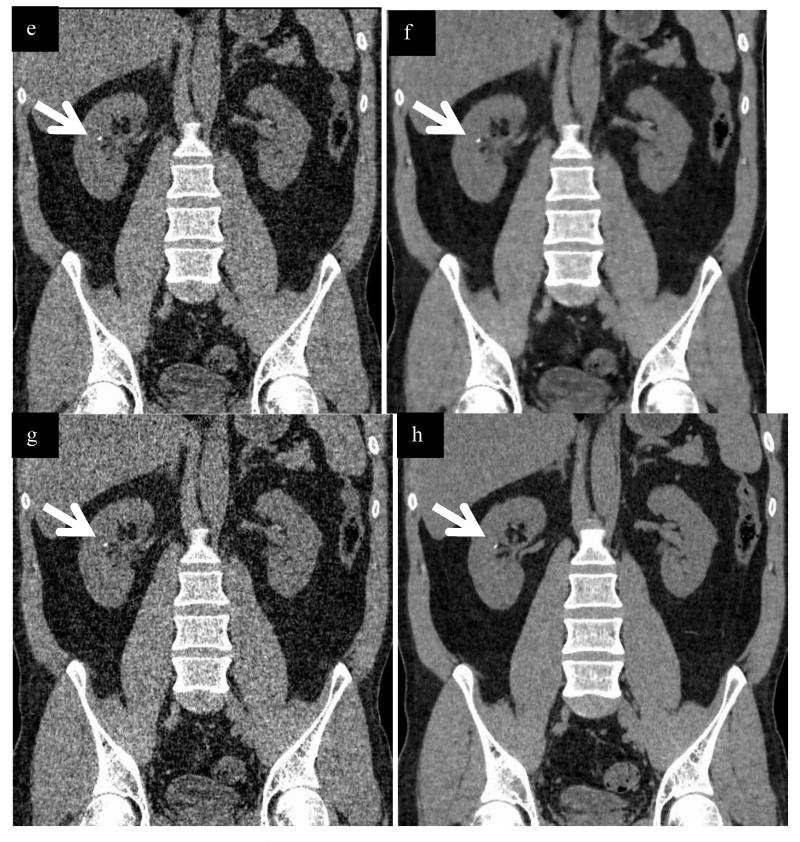
Figure 4.
Non contrast images from a 41 year old male with a BMI of 28.8 and effective diameter of 29.6 cm undergoing a flank pain protocol to evaluate for urolithiasis. Transverse CT images were obtained at the level of the sacroiliac joint, with the reduced dose reconstructed with ASIR (a), PICCS (b), FBP (c) compared to the standard dose FBP image (d). Coronal images obtained at the level of the kidneys with corresponding reconstructions (RD ASIR e, RD PICCS f, RD FBP g, SD FBP h). Note the small calculus in the interpolar region of the right kidney (arrows, e-h). Images were also evaluated in the transverse and coronal planes at the level of the main portal vein as depicted in figure 2. The SSDE of the reduced dose series was 1.8 mGy, compared to 9.7 for the standard dose, a dose reduction of approximately 81%.


