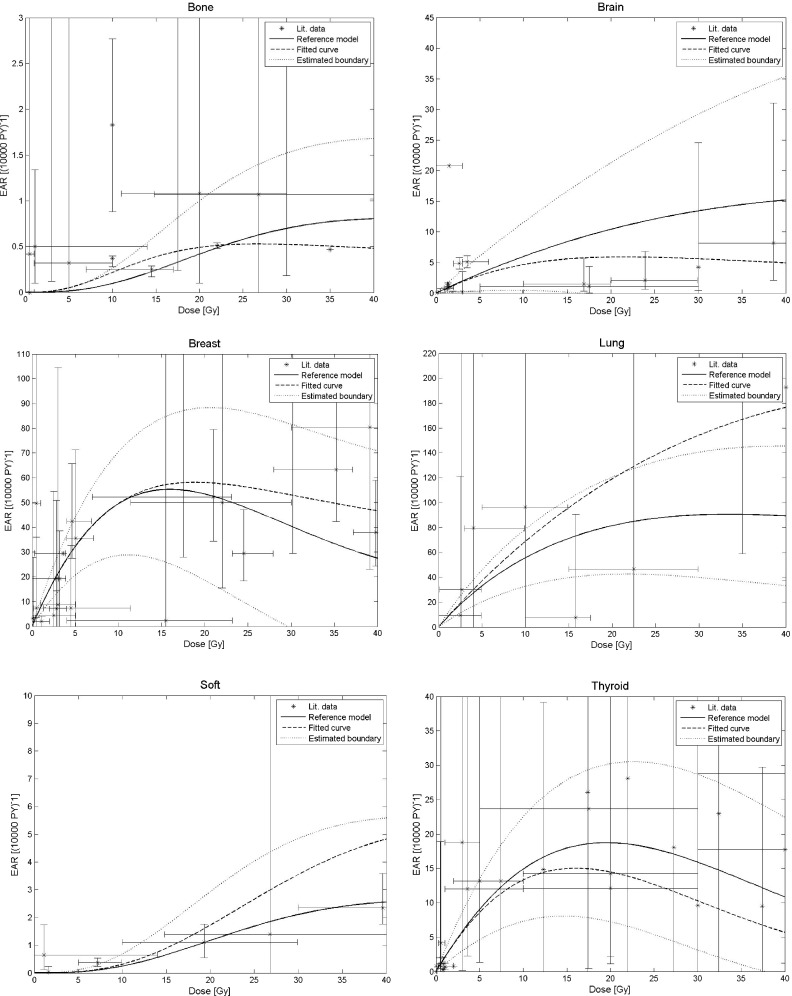
FIG. 1.
Comparison of the reported second cancer incidence data shown in Table II and the prediction of the reference model as a function of dose. The black dotted lines show the estimated uncertainty when applying the reference model (solid line) using Tables I and V and Eq. (13). Also shown is a fit of the S-model using the data listed in Table II (dashed line). Age at exposure and attained age were set to 30 and 70, respectively.

