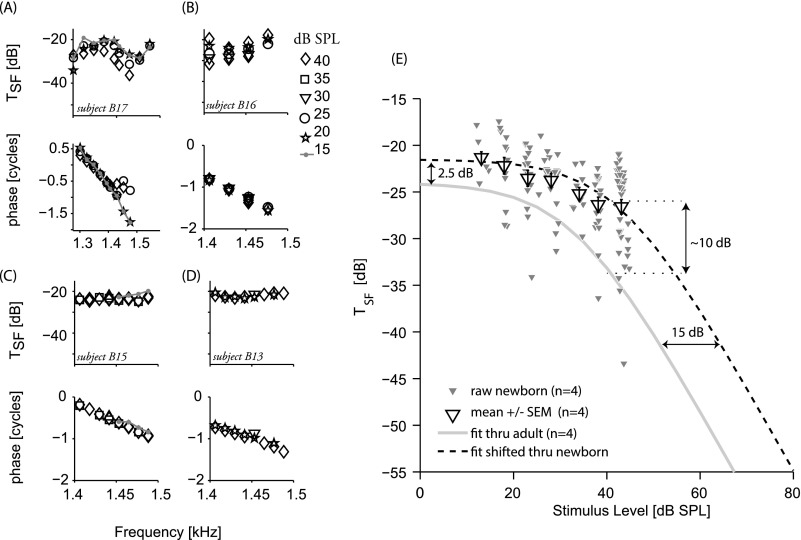
Fig. 2.
SFOAE level dependence. (A)–(D) SFOAE magnitudes and phase (represented as transfer functions) in four newborns. SFOAEs were measured with stimulus levels ranging from 15 to 40 dB SPL (different symbols for different levels). (E) Transfer function magnitudes in the same four newborns plotted against probe level (small triangles); across-subject averages are shown with their SEMs (large triangles). The gray line is a fit representing the level dependence of adult SFOAEs recording in a previous study (Kalluri and Shera, 2007b). The dashed line is the same fit shifted along the x axis by 15 dB SPL [to account for effects of middle-ear immaturities (Abdala and Keefe, 2006)] and along the y axis by10 dB (to account for the differences in emission amplitudes between newborns and adults at probe levels of 40 dB SPL).

