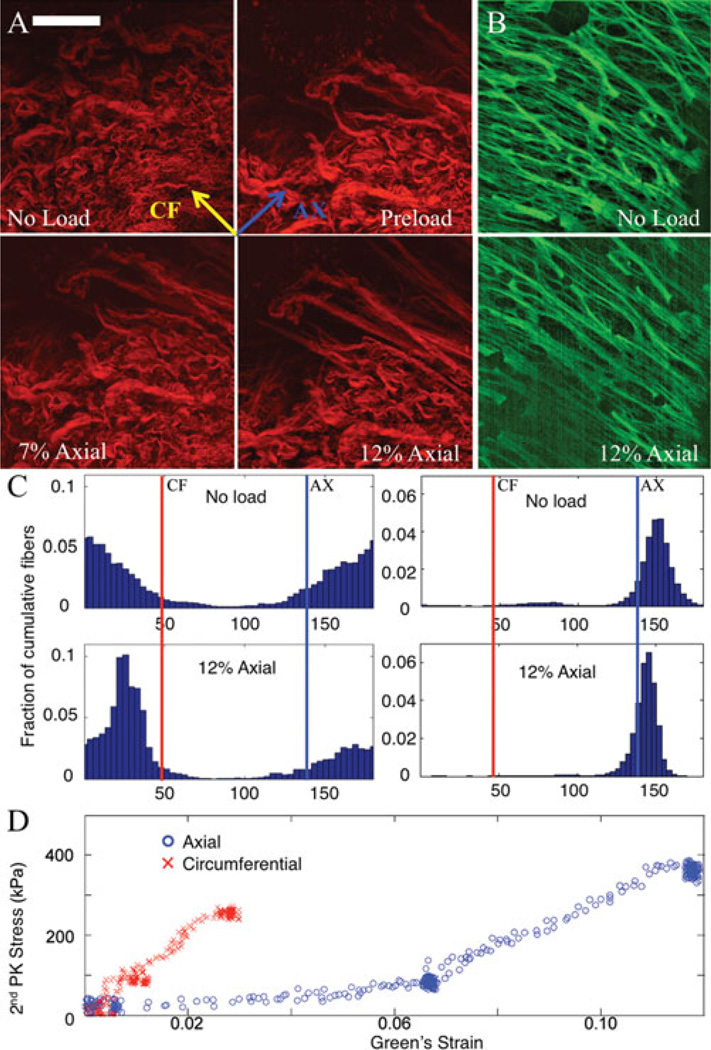
Figure 4.
(Color online): A Representative mosaic of fibers from porcine coronary artery in different load states. Scale bar is 100 µm. Top left of the red fibers (collagen) shows an unloaded state; top right shows a preloaded state; bottom left and bottom right show a 7% and 12% axial strain loading, respectively. B: Elastin signal is shown with the two images to the right (green) at 12% axial strain and preloaded states. C: Quantification of fiber orientation between load states. Left two histograms are of collagen, and right two are elastin. Top is with no load, and bottom is under 12% axial strain. D: Stress-strain plot of macroscopic data.

