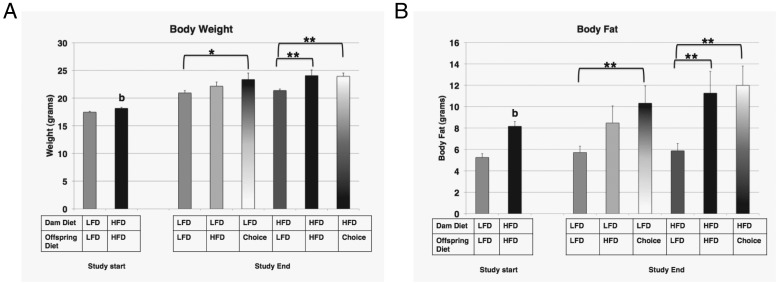
Figure 3. Body weight and fat in offspring.
Body weight (grams) (A) and body fat (grams) (B) for offspring from the 2 groups at study start or the 6 groups at study end. The diets for each group are indicated. For the effect of offspring diet (identical maternal diet): *, P ≤ .05; **, P ≤ .01; For the effect of maternal diet (identical offspring diet).

