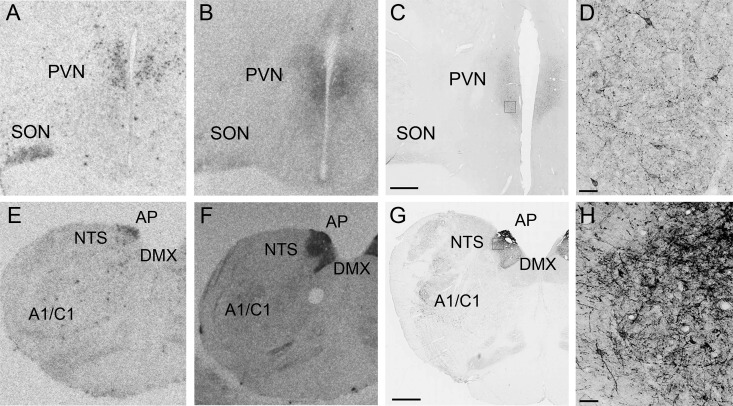
Figure 1. Confirmation of GLP-1R antibody specificity using ISH and ISLB.
GLP-1R distribution using ISH (A and E), ISLB (B and F), and IHC (C and D and G and H) in the hypothalamus at the level of the PVN (A–D) and AP/NTS (E–H). D, High-power magnification of C. H, High-power magnification of G. Scale bars, 1000 μm (C and G) and 50 μm (D and H).

