
Figure 7. Schematic representation and photomicrographs of GLP-1R-ir distribution in the NHP hindbrain.
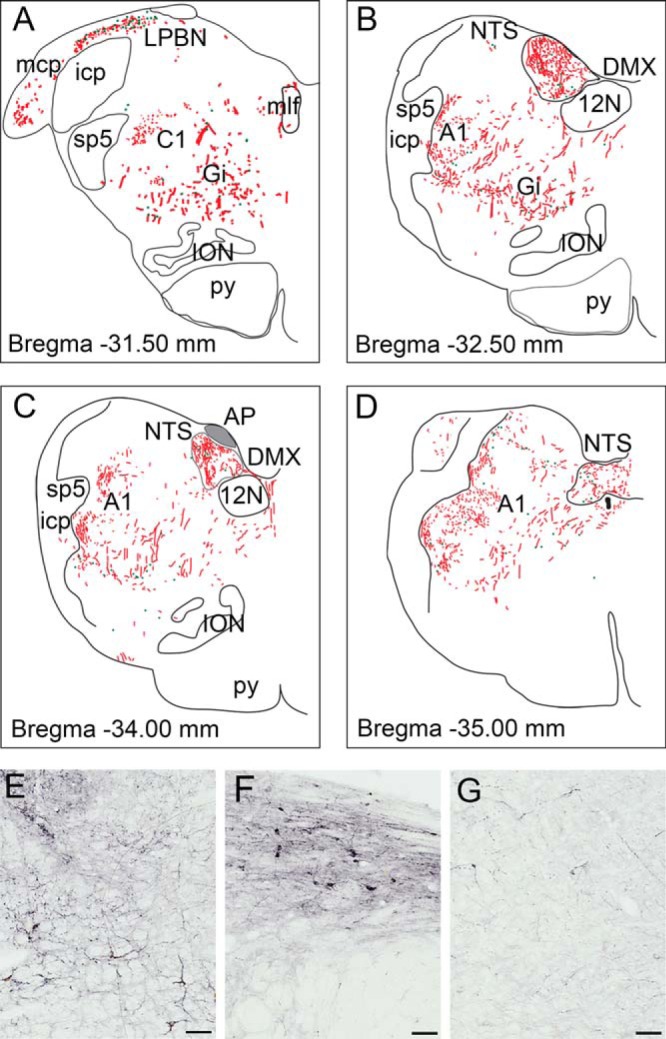
Depiction of GLP-1R-ir cell bodies (green dots) and GLP-1R-ir fibers (red lines) in hindbrain sections arranged from rostral (A) to caudal (D). Gray shaded area in the AP indicates dense fiber network. Photomicrographs of GLP-1R-ir are shown in the A1 area (E), LPBN (F), and Gi (G). 12N, hypoglossal nucleus; A1, noradrenergic cell group; C1, adrenergic cell group; icp, inferior cerebellar peduncle; ION, inferior olivary nucleus; mcp, middle cerebellar peduncle; mlf, medial longitudinal fasciculus; py, pyramidal tract; sp5, spinal trigeminal tract. Scale bars, 100 μm.