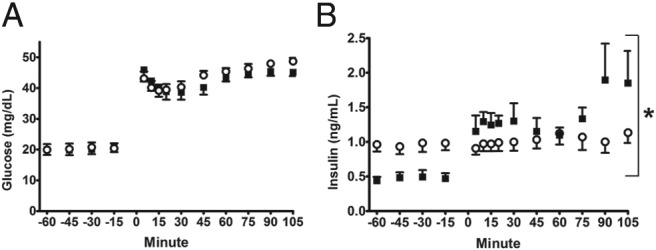
Figure 4. Fetal insulin secretion at the end of the treatment period.

Mean ± SE fetal arterial plasma glucose (A) and insulin (B) concentrations are shown relative to the start of the primed continuous variable-rate hyperglycemic clamp (time, 0 min). Open circles, INS (n = 8); solid squares, CON (n = 9). *, significant difference between INS and CON, P < .05 by mixed models ANOVA.
