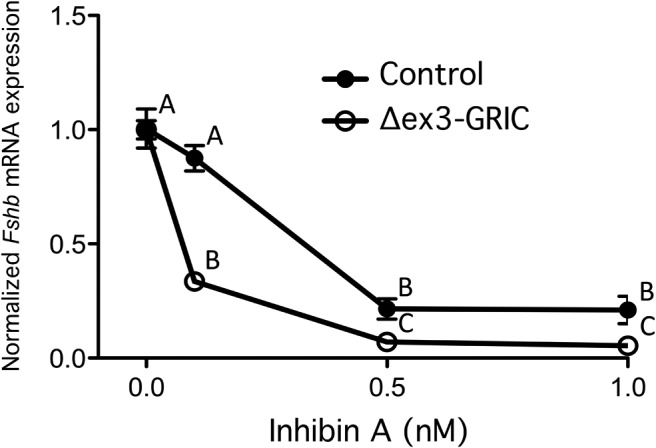
Figure 6. Ex vivo inhibin sensitivity assay.

Real-time RT-PCR analyses were done on primary cultured pituitary cells from male Δex3-GRIC and control mice to assess the ability of graded doses of inhibin A to suppress Fshb mRNA expression. Because untreated Δex3-GRIC cells express higher intrinsic levels of Fshb than controls (as seen in Figure 2A), data were normalized for each genotype relative to the untreated samples, so as to better demonstrate differences in inhibin sensitivity. Error bars, SEM. Data points labeled with different letters were statistically different (P < .05, two-way ANOVA with Tukey's post hoc test).
