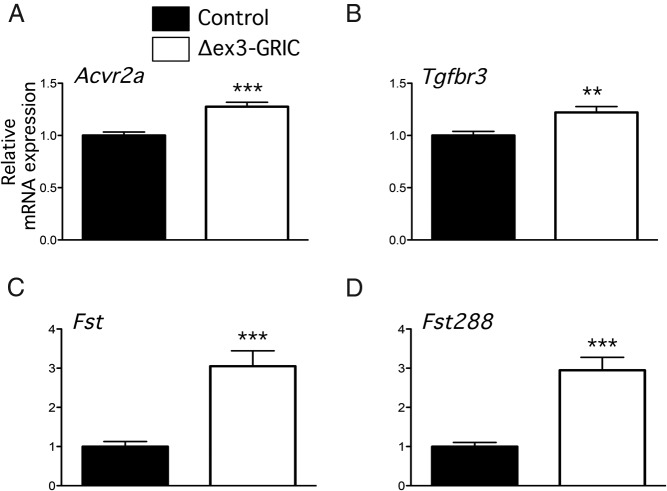
Figure 7. Gene expression of Acvr2 (A), Tgfbr3 (B), Fst (C), and Fst288 (D) in Δex3-Gric pituitary cells.
Real-time RT-PCR analyses of the indicated transcripts in the pituitary glands of adult Δex3-GRIC (n = 18) and control males (n = 18). Columns, means; error bars, SEM. Significant difference from control is indicated with asterisks (**, P < .01; ***, P < .001, unpaired t test).

