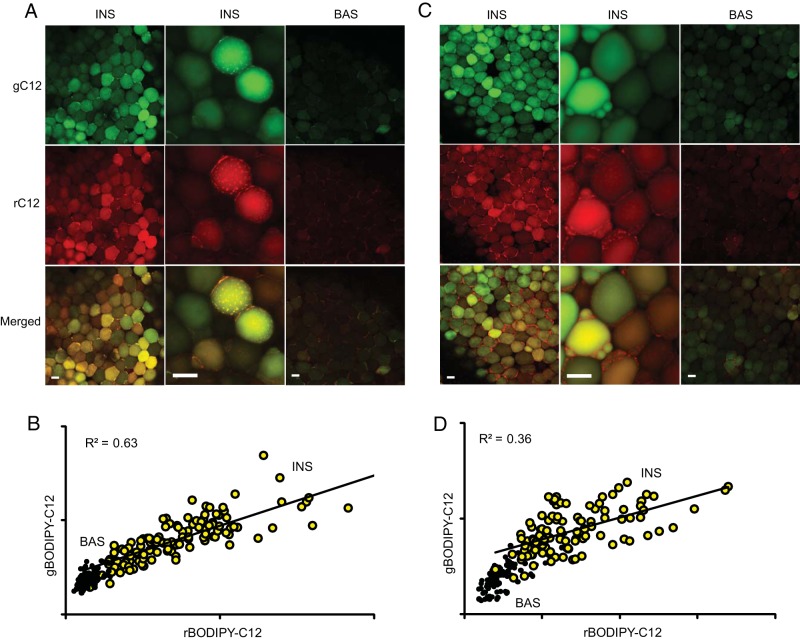
Figure 3. Changes in individual adipocyte responses over time.
A and B, Omental WAT explants were incubated for 2 hours under basal conditions (BAS) or with 10 nM insulin (INS), labeled with a mixture of green and red fluorescent BODIPY-C12 for 15 minutes, and chased in BODIPY-free basal or insulin-containing media for 30 minutes, as described in Materials and Methods. C and D, The experiment was repeated as described in panel A, except red BODIPY-C12 (rC12) was added 24 hours after the removal of green BODIPY-C12 (gC12). Quantification of total intracellular BODIPY-C12 and 2-NBDG fluorescence for the experiments shown in panel A (B) and panel C (D). Yellow circles, insulin treated; black circles, basal. Red and green channels show significant correlation under insulin-stimulated conditions (P < .001). Scale bar, 50 μm. Total BODIPY-C12 and 2-NBDG fluorescence per cell and cell areas are shown in arbitrary units.

