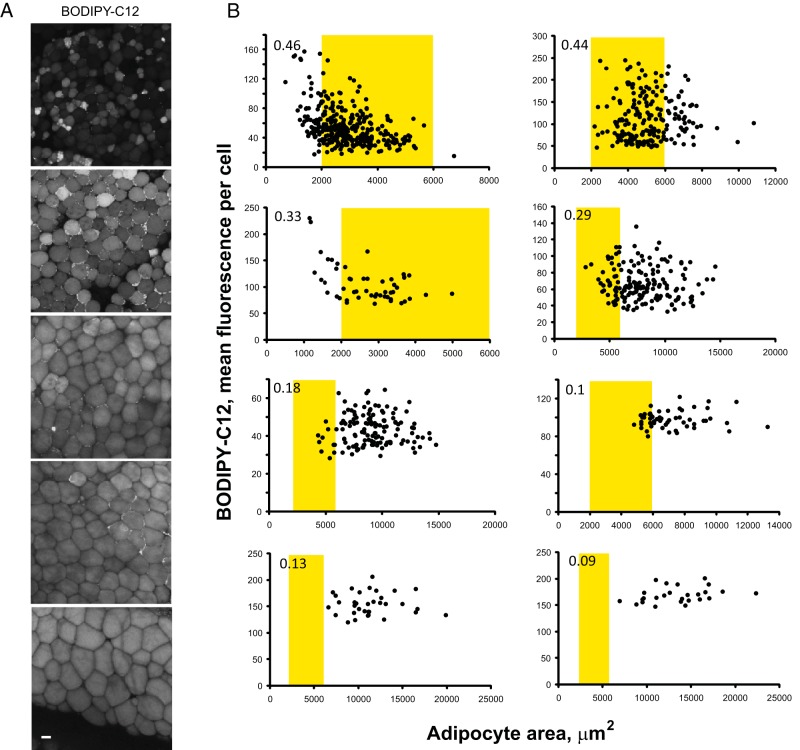
Figure 5. Adipocyte hypertrophy correlates with the loss of WAT mosaicism.
WAT biopsies collected from several control male rhesus were treated with insulin for 2 hours, labeled with BODIPY-C12 for 15 minutes, and chased in the BODIPY-free media for 30 minutes in the presence of insulin. A, Images show representative examples of adipocytes from animals containing small (top two panels), intermediate (middle panel), and large adipocytes (bottom two panels). Scale bar, 50 μm. B, Graphs depict the quantification of mean intracellular BODIPY-C12 fluorescence as a function of cell area for 8 animals (see Materials and Methods for details). Smaller adipocytes display a greater heterogeneity evident by a larger coefficient of variation (shown in the upper left corner of each graph). The areas shown in yellow indicate average adipocyte sizes found in lean animals (50 to 90 μm).

