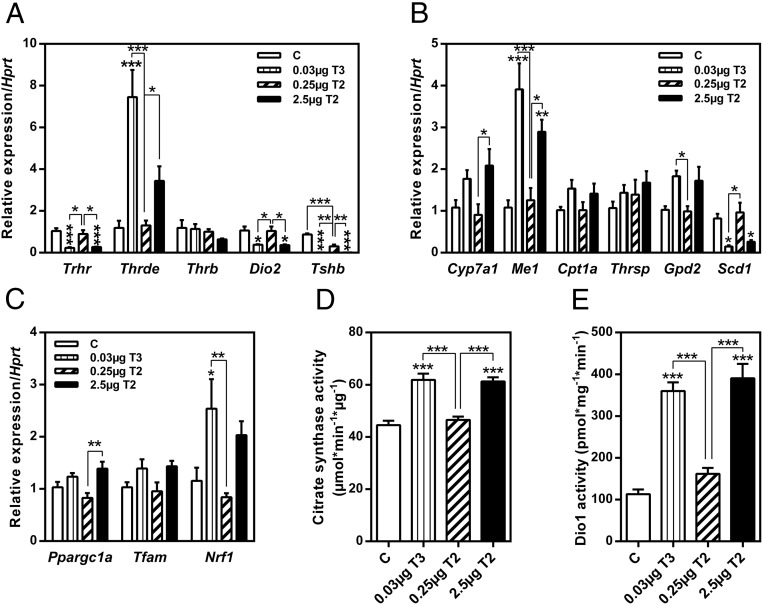
Figure 3. Treatment of mice with 3,5-T2 or T3 affected regulation of HPT axis and its negative feedback mechanisms.
Pituitary gene expression (A), expression of hepatic target genes (B) and of mitochondrial biogenesis in liver tissue (C), hepatic CS activity (D), and hepatic Dio1 activity (E). Data are expressed as mean ± SEM. *, P < .05; **, P < .01; ***, P < .001 vs control or as indicated (n = 6–8).

