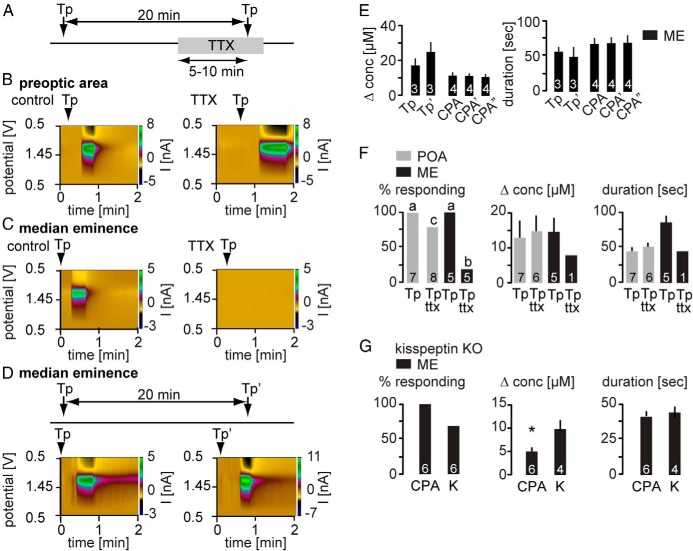
Figure 2. Increasing intracellular Ca2+ by blocking SERCA pumps elicits GnRH release in the POA and ME but requires action potentials only in the ME.
A, Experimental timeline for B and C. B and C, Representative examples of thapsigargin (Tp)-evoked GnRH release shown as a current heat map during the control period (left) and TTX treatment (right) in the POA (B) and ME (C). D, top, Experimental timeline. Bottom, Repeated injection of Tp under control conditions induces repeated GnRH release in the ME. E, Mean ± SEM peak GnRH release amplitude (left) shown as change in concentration and release duration (right). Numbers within bars indicate sample size; ' indicates second injection; “ indicates third injection of CPA, accordingly. F, Mean ± SEM percent responding to Tp (left), concentration change (center), and release duration (right). Gray bars show POA, black bars show ME; lower case letters indicate P < .05 χ2 test. G, GnRH release in response to CPA is not blocked in kisspeptin (K) KO mice. Mean ± SEM percent responding to CPA or kisspeptin (K) (left), concentration change (center), and release duration (right); asterisks indicate P < .05 with Student's t test.

