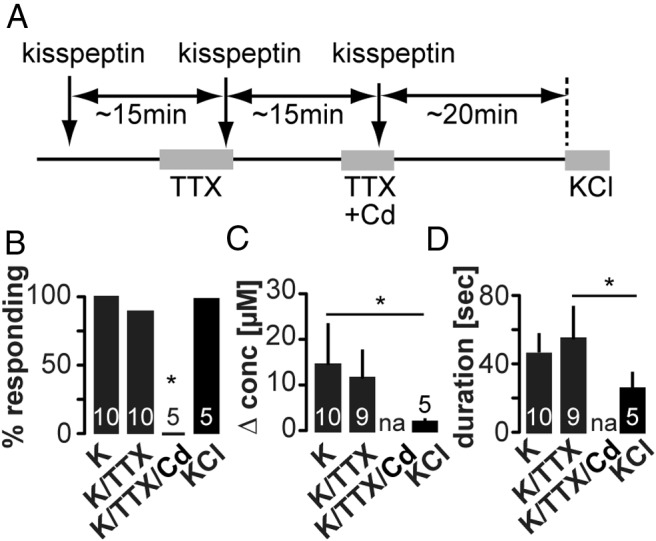
Figure 5. Blockade of both action potentials and soma membrane voltage-gated calcium channels prevents kisspeptin-induced GnRH release in the ME.

A, Experimental timeline; arrows indicate local, and gray bars indicate bath application. B–D, Mean ± SEM percent of cells responding to kisspeptin in the ME (B), peak GnRH release amplitude (C) shown as change in concentration, and release duration (D). Numbers within bars indicate sample size, asterisks indicate P < .05 χ2 test (B), one-way ANOVA with Tukey's multiple comparison test (C and D).
