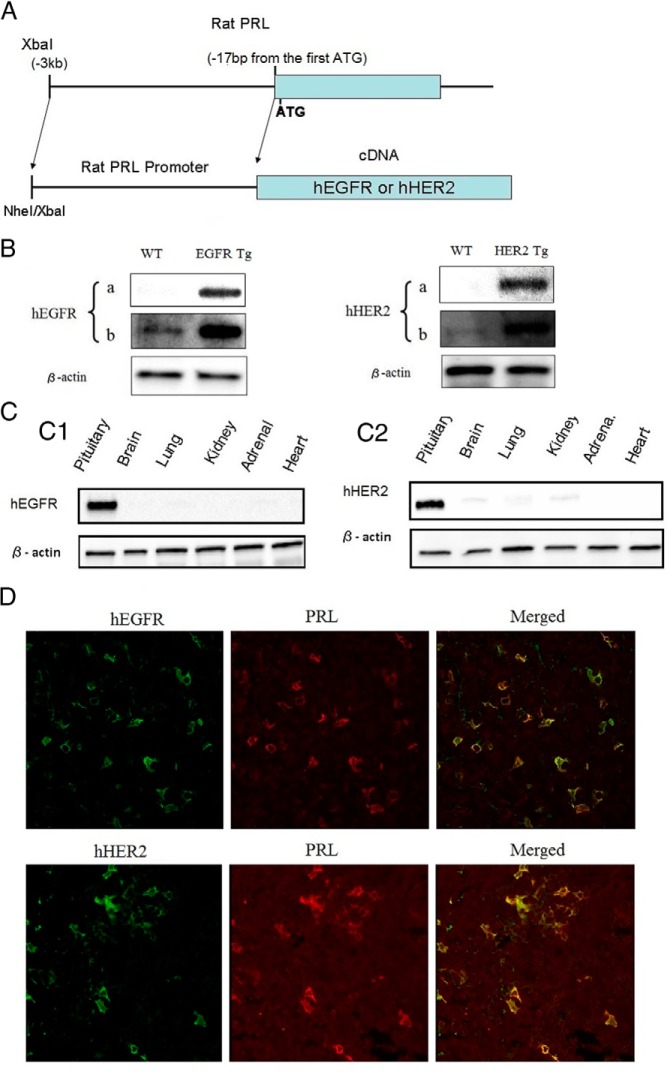
Figure 1. Generation of hEGFR or hHER2 transgenic mice.
A, hEGFR or hHER2 transgenic mice were generated using the rPRL enhancer/promoter system. Structure of hEGFR or hHER2 expression units were illustrated. B, Whole-cell extracts were prepared using pituitaries from WT, EGFR, and HER2 transgenic mice, and immunoblotting was performed using anti-EGFR, anti-HER2, and antiactin (as a control). To show expression levels of human transgenes and endogenous mouse EGFR and Her2 (observed in WT mice), a short (a, 60 s) and a long (b, 300 s) exposed image are depicted. C, Immunobloting using whole-cell extracts from indicated tissues of the transgenic mice was performed with anti-EGFR, anti-HER2, and antiactin. D, Histochemical staining of pituitary from EGFR/HER2 transgenic mouse using anti-EGFR and anti-HER2 conjugated with Alexa Fluor goat antirabbit 488 (green) and anti-PRL conjugated with Alexa Fluor donkey antimouse 568 (red). Staining was analyzed by confocal microscopy. To confirm colocalization of hEGFR/PRL and hHER2/PRL, merged image is also shown (×63 magnification).

