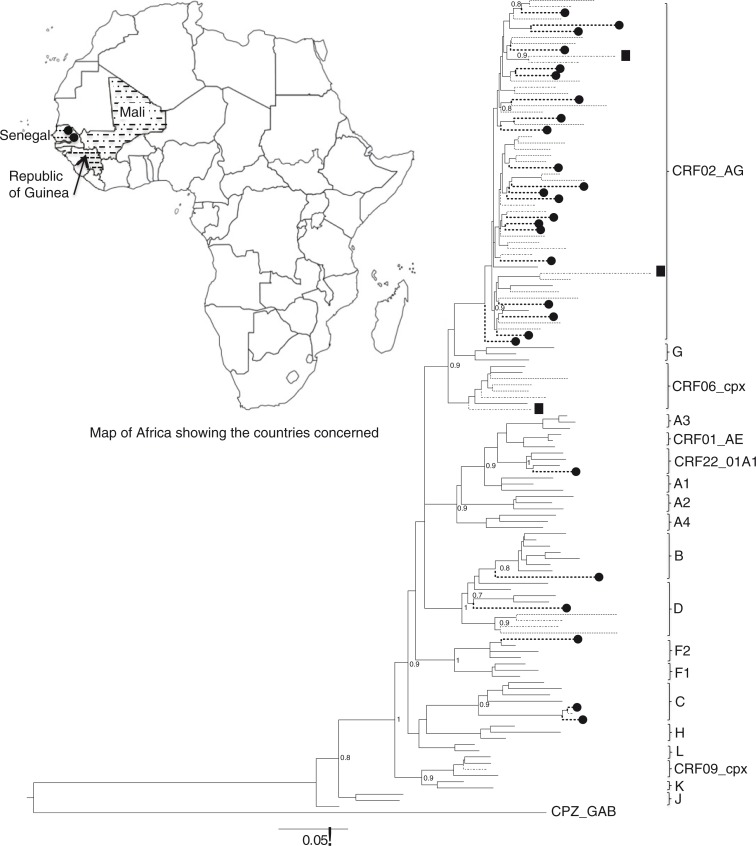
Figure 2.
Maximum likelihood tree showing the relationships between pol sequences isolates from Senegal (-------●), Mali (-·-·-) and Guinea-Conakry (------). The corresponding legends are used to localise each country on the map. # Designate URFs. The reference strains are in continuous lines. The tree was constructed under the GTR+I+G model of evolution using PhyML on online program http://www.atgc-montpellier.fr/phyml.

