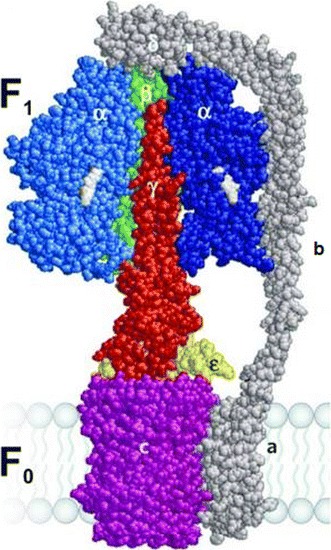
Fig. 2.

Structure of ATP synthase in membrane. Symbols—α, β, γ, δ, ε, b 2, a, indicate subunits of ATP synthase. Space-filling homology model of EF0F1 with one α-subunit and two β-subunits removed to expose the γ-subunit (red) in the center of the (αβ)3-pseudohexagon, with α shown in blue, β in green, γ in red, ε in yellow, δ (on top) and subunits a and b in dark gray, nucleotides in pale gray, and c10 in magenta. The bulge of subunit γ (made up of the convex coiled coil consisting of the N- and C-terminal helices of γ) is not visible because it points away from the viewer. This figure is reproduced from Wächter et al. (2011) with the permission of Wolfgang Junge
