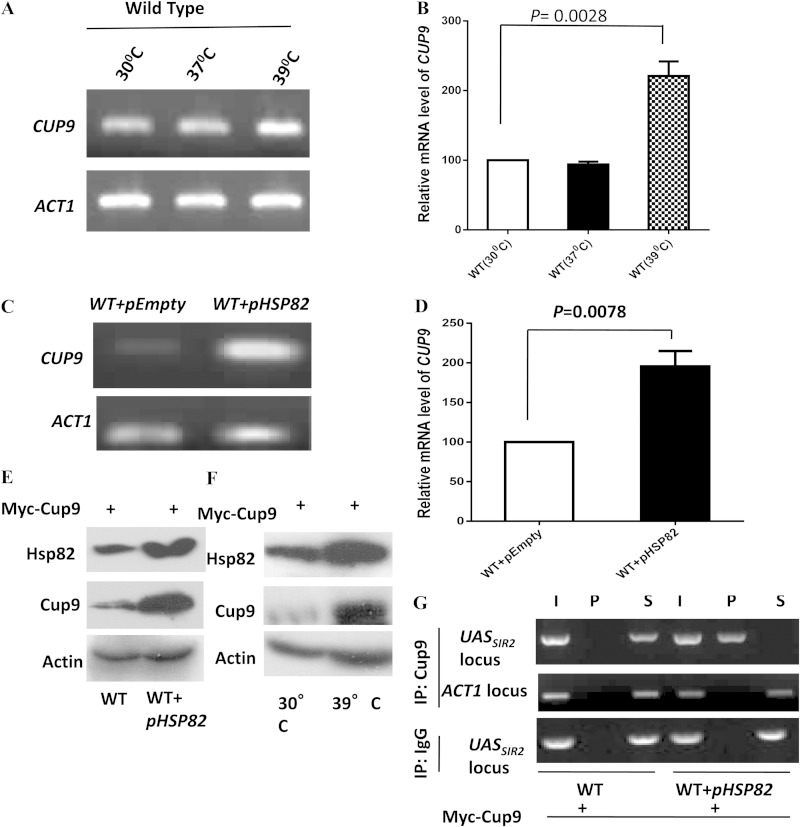
FIG 6.
Heat shock and Hsp82 overexpression induce Cup9 expression and lead to its association with SIR2UAS. (A) Wild-type cells were divided into three groups: one grown at 30°C, another exposed to 37°C for 2 h, and the last exposed to 39°C for 40 min. Semiquantitative RT-PCR results for all groups show the CUP9 transcript profile at the different temperatures. ACT1 acted as the normalization control. (B) Real-time RT-PCR shows the quantitative abundance of the CUP9 transcript at 39°C compared to that at 30°C. Each bar represents mean mRNA level (±SD) from three independent experiments. P values were calculated using the two-tailed Student t test. (C) Wild-type cells and cells bearing the Hsp82 overexpression plasmid were used to assess the level of the CUP9 transcript by employing semiquantitative RT-PCR. The experiment was repeated three times; data from one representative experiment are presented here. (D) Real-time RT-PCR reveals the quantitative abundance of the CUP9 transcript in cells bearing HSP82 overexpression plasmid compared to that in the wild type. (E) In wild-type cells, CUP9 was MYC tagged at the chromosomal locus as described in Materials and Methods. Proteins isolated from wild-type cells and cells having the Hsp82 overexpression plasmid were subjected to Western blot analysis using anti-Myc (Cup9), anti-Hsp82, and antiactin antibodies. (F) The same cells were subjected to 39°C for 40 min, and heat-treated and untreated cells both were subjected to immunoblotting using antiactin, anti-Hsp82, and anti-Myc antibodies. (G) ChIP assays were performed using CUP9 MYC-tagged cells in the absence and presence of Hsp82 overexpression plasmid. Anti-Myc antibodies were used with control IgG (immunoglobulin G). Input (I), immunoprecipitated DNA (P), and supernatant (S) were amplified by semiquantitative RT-PCR with primers that covered SIR2UAS. The experiment was repeated twice; data from one representative experiment are presented. I, P, and S DNA were also amplified using primers that cover ACT1, which acted as a negative control.

