
Figure 2. Inhibition of intrinsic apoptosis activates the IFN response.
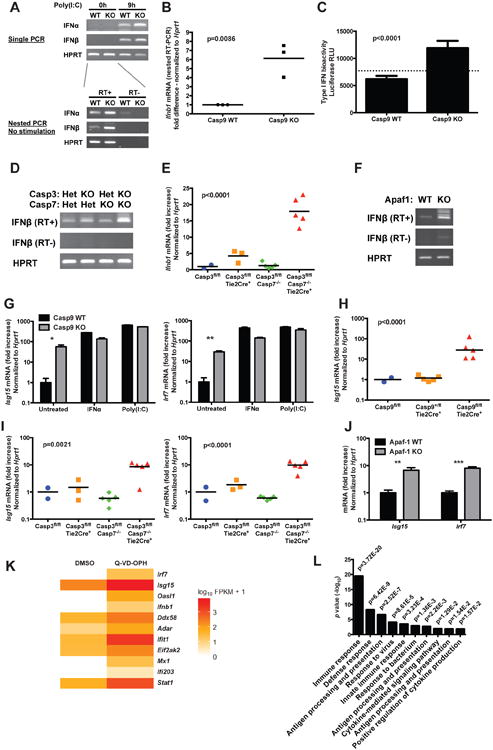
(A) The expression of IFNα and IFNβ mRNA was determined by RT-PCR in Casp9 WT and KO primary MEFs. Top: single RT-PCR on untreated cells and on cells transfected with poly(I:C) as a positive control. Bottom: nested RT-PCR on untreated cells (RT+, RNA reverse transcribed in cDNA; RT-, no reverse transcription).
(B) The steady-state expression of IFNβ mRNA expression in unstimulated primary MEFs was quantified by nested realtime RT-PCR. Each dot represents an independent experiment; p value: two-tailed unpaired Student t-test.
(C) Type I IFN bioactivity in the culture supernatant of unstimulated MEFs was measured using an ISRE-Luc reporter cell line (mean ± s.d. of 6 replicates, representative of 2 independent experiments; p value: two-tailed unpaired Student t-test; the dashed line indicates background from untreated reporter cells).
(D) Nested RT-PCR amplification of steady state IFNβ in Casp3/7 double deficient and control MEFs.
(E) IFNβ mRNA expression measured by realtime RT-PCR in Casp3/7 deficient and control spleen cells (n=2-5 mice/genotype; p value calculated by one-way ANOVA).
(F) Nested RT-PCR amplification of steady state IFNβ in Apaf-1 WT and KO MEFs.
(G) The expression of selected ISGs in Casp9 WT and KO primary MEFs was measured by realtime RT-PCR. IFNα and intracellular poly(I:C) were used as positive controls (mean ± s.d. of duplicates, representative of at least 5 independent experiments). *, p<0.05; **, p<0.01; ***, p<0.001; two-tailed unpaired Student t-test.
(H and I) ISG mRNA expression measured by realtime RT-PCR in Casp9 deficient and control white blood cells (H) or in Casp3/7 double deficient and control spleen cells (I) (n=2-5 mice/genotype; p value: one-way ANOVA).
(J) ISG mRNA expression measured by realtime RT-PCR in Apaf-1 WT and KO primary MEFs (mean ± s.d. of triplicates, representative of 3 independent experiments; p value calculated by two-tailed unpaired Student t-test).
(K) Heatmap of the expression of IFNβ and selected ISGs in WT primary MEFs stimulated for 48h with vehicle (DMSO) or with the caspase inhibitor Q-VD-OPH (10 μM).
(L) Gene Ontology analysis of the pathways overrepresented among genes differentially expressed between WT primary MEFs stimulated with vehicle or with Q-VD-OPH.
See also Figure S3 and S5, and Table S1.