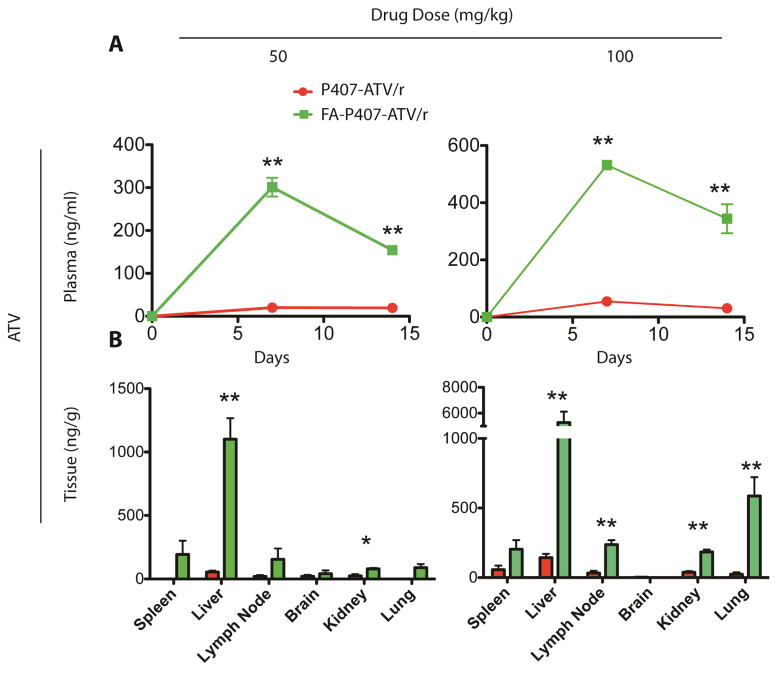
Figure 2.
Pharmacokinetics of FA-P407- and P407- ATV/r in Balb/cJ mice. FA-P407-ATV/r and P407-ATV/r were administered at a dose of 50 mg/kg or 100 mg/kg by intramuscular injection on day 0, and mice were sacrificed on day 14. (A) Plasma was collected at indicated time points and ATV and RTV levels were quantified by UPLC-MS/MS. Data are expressed as mean ± SEM. * Statistically different from P407-ATV/r at P < 0.05 by 2-way ANOVA and Bonferroni’s posthoc test. (B) Comparison of tissue distribution of ATV and RTV after FA-P407-ATV/r and P407-ATV/r treatment in Balb/cJ mice. The indicated tissues were collected on day 14 after sacrifice, and ATV and RTV levels were quantified by UPLC-MS/MS. Data are expressed as mean ± SEM and *, **statistically different from P407-ATV/r at P < 0.05 and P < 0.01 by student’s unpaired t-test respectively.

