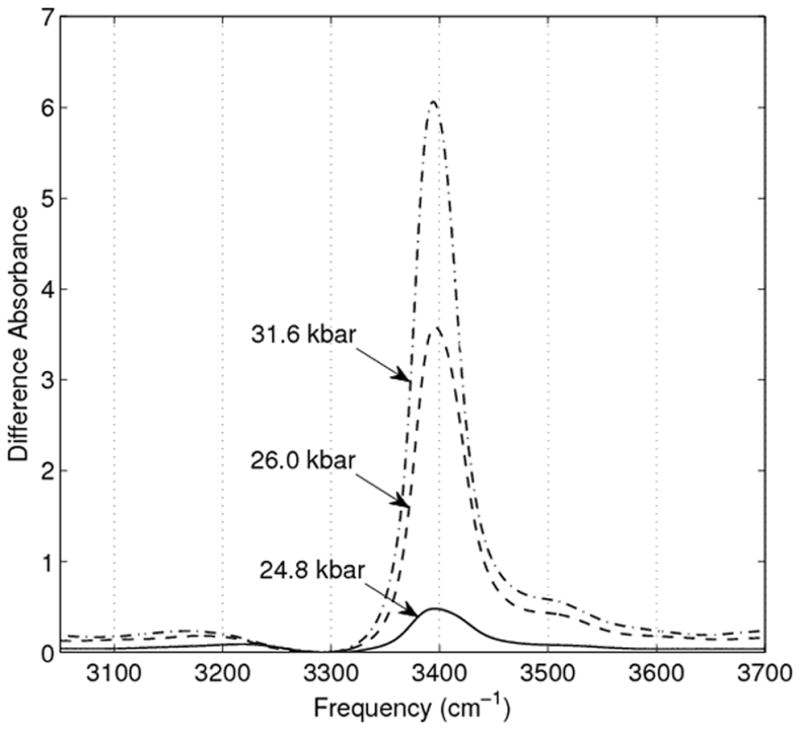
Figure 3.

OH stretch difference spectra generated using the method described in the Results section. In short, the ~3290 cm−1 bands of the presumed ice VII spectra were normalized to the 3290 cm−1 of the highest pressure (23.8 kbar) pure ice VI spectrum, which was then subtracted from the normalized spectra.
