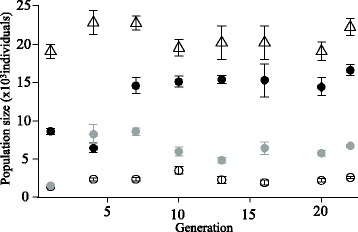
Figure 2.

Changes in average population size in the different treatments between generations 1 and 22. Symbols show the mean value and standard error over six replicated populations in control (empty triangles), uranium (filled black dots), salt (empty dots) and alternating uranium-salt (filled gray dots) treatments.
