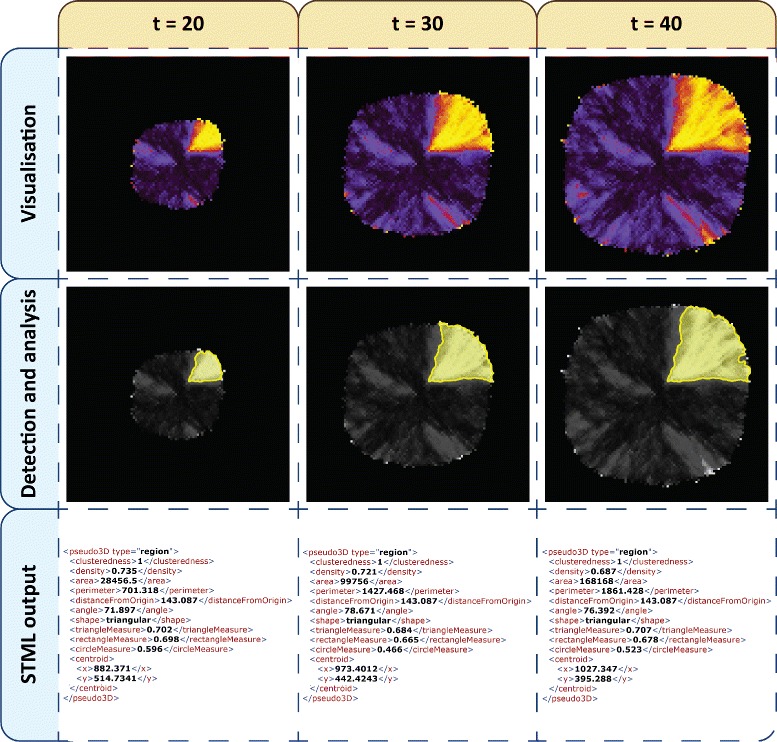
Figure 7.

Spatio-temporal detection and analysis of a phase variation model simulation. Each column corresponds to a different timepoint from the simulation (t = 20, 30 and 40). The rows considered from top to bottom represent the stages of translating timeseries data to STML output files (Visualisation as images, automatic detection and analysis of regions/sector-like patterns, and output in STML format).
