
Figure 13.
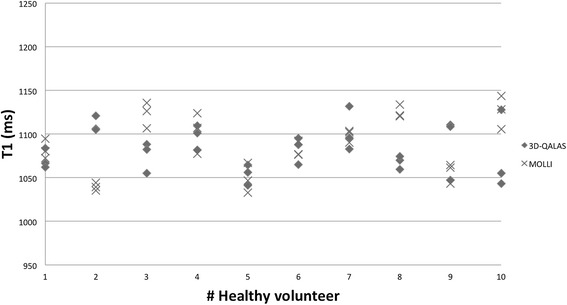
Individual myocardial T1 values from 3D-QALAS and MOLLI. Values are derived from four regions of interests (septal,anterior,lateral and posterior) in a mid-cavity short axis slice from three repeated measurements and are displayed as mean values representing each measurement.