
Figure 3.
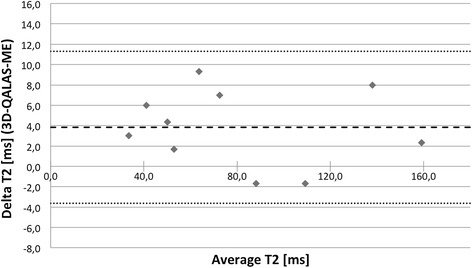
Bland-Altman plot for T2 values at 60 bpm with 3D-QALAS and multi echo in phantoms. Thick dashed line represents overall average difference between measurements (3.8 ms), thin dashed lines represent 2SD.
Official websites use .gov
A
.gov website belongs to an official
government organization in the United States.
Secure .gov websites use HTTPS
A lock (
) or https:// means you've safely
connected to the .gov website. Share sensitive
information only on official, secure websites.
Bland-Altman plot for T2 values at 60 bpm with 3D-QALAS and multi echo in phantoms. Thick dashed line represents overall average difference between measurements (3.8 ms), thin dashed lines represent 2SD.