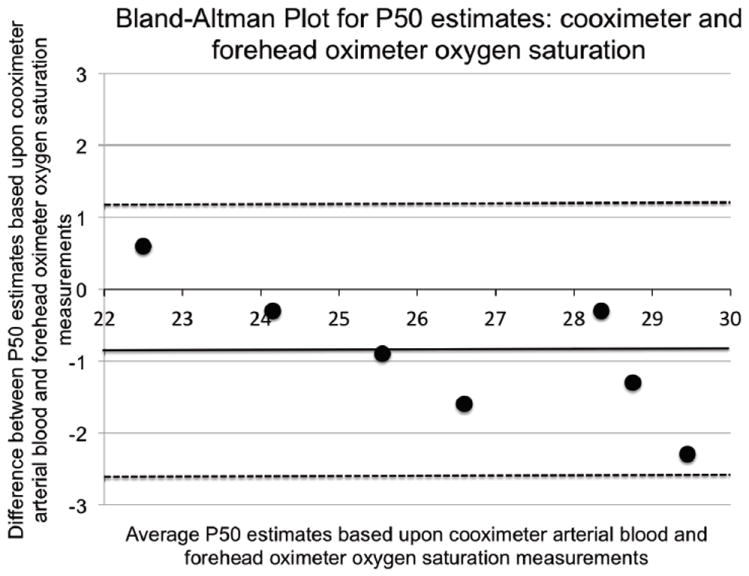
Figure 1.

Bland-Altman plot comparing P50 estimates based on arterial blood cooximeter to forehead oximeter saturation measurements in seven sea level subjects (70-100% values, which are within the range examined in Tibetan and Han Chinese subjects examined at 4200 m, are included).Mean difference, standard deviation: (-0.87, 0.96); 95% confidence limits (-2.76, 1.01) are shown as dashed lines; a solid line indicates identity.
