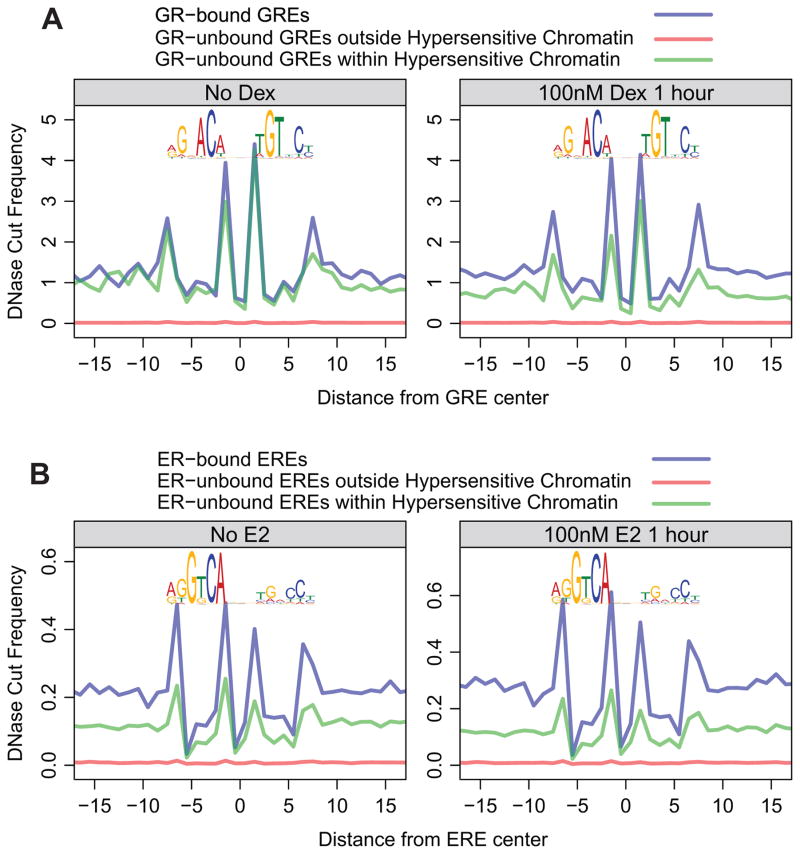
Figure 2. DNase signatures precede nuclear receptor binding and do not result from protein-DNA interactions.
(A) GREs were classified into three classes: 1) overlapping with GR ChIP-seq peaks (transparent blue trace); 2) overlapping neither GR ChIP-seq peaks nor DNase hotspots (transparent red trace); 3) not overlapping with GR ChIP-seq peaks, but overlapping DNase hotspots (transparent green trace). The motif logos above the traces are composite GR binding motifs derived from ChIP-seq data. Each trace shows the average cut frequency at each position between nucleotides. The left panel shows that these signatures are present prior to GR binding to DNA; the right panel shows that these traces do not change upon GR-binding. ChIP-seq and DNase-seq data are from the mammary 3134 cell line. (B) The same analysis was performed for ER in the bottom panels. The MCF-7 ChIP-seq and DNase-seq data are from Guertin et al. (submitted) and ENCODE. (See also Figure S3)

