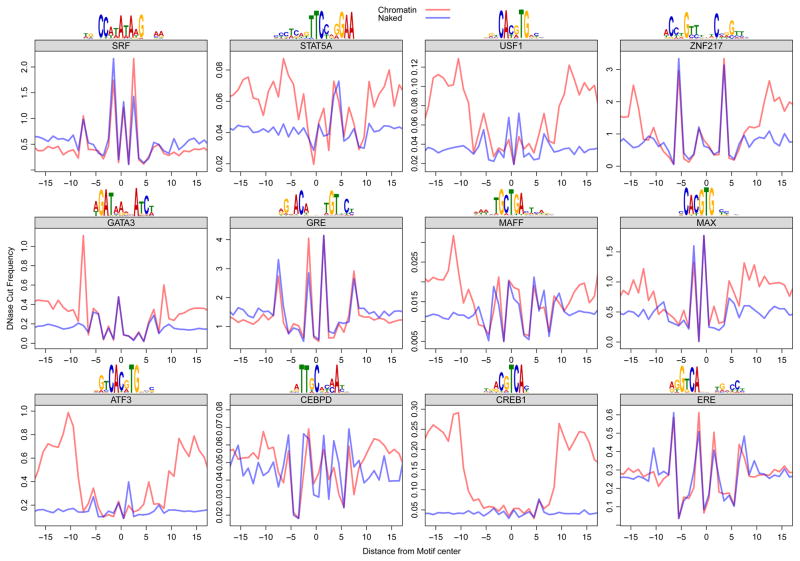
Figure 3. DNase digestion of deproteinized (naked) DNA and TF-bound chromatin reveals the same cut signatures at consensus binding sites.
For each factor, we used genomic ChIP-seq data (Gerstein et al., 2012) to identify the bound regions in the genome. We used the position weight matrix for each factor to infer the precise position of TF binding within the ChIP-seq peaks. The red trace shows the average DNase cut frequency at each position over all TF motif sites within ChIP-seq peaks for that particular TF. The blue trace shows the scaled (to equalize the maximum and minimum y values across profiles over each motif) average DNase cut frequency at all TF motif sites in the genome, noting that the DNase data was derived from naked DNA digestion. The traces flanking the motif are divergent, but the traces largely overlap within the consensus-binding site for each TF.

